 |
| If you’re having trouble reading this, click here. |
 |
| Global Manufacturing Economic Update |
|
|
|
|
| Essential Takes on Leading Economic Indicators |
|
By Chad Moutray – June 11, 2020– SHARE


|
|
|
|
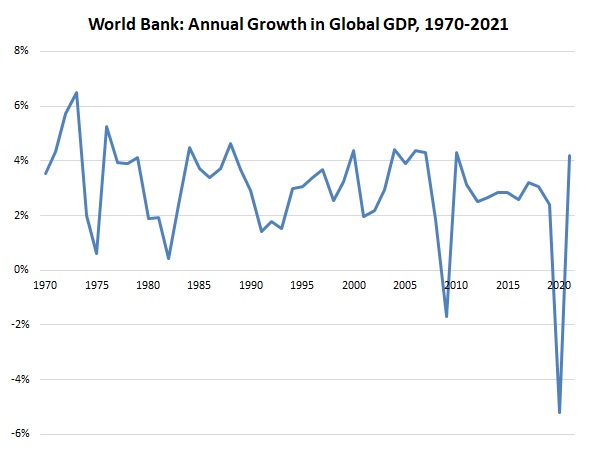
| World Bank: Global GDP Will Fall 5.2% in 2020, but Rebound by 4.2% in 2021 |
|
| The Monthly Toplines |
|
- The World Bank forecasts a decline of 5.2% in real global GDP in 2020, following 2.4% growth in 2019. It would be the worst decrease in worldwide growth since the aftermath of World War II, with global economies sharply pulling back on activity during the COVID-19 pandemic. With that said, the global economy should rebound in 2021, with worldwide growth jumping 4.2%.
- After dropping to its lowest point since March 2009, the J.P. Morgan Global Manufacturing PMI rebounded somewhat. It rose from 39.6 in April to 42.4 in May, with activity still declining sharply despite some progress. Manufacturers are cautiously upbeat about better production data over the next six months as firms ramp up activity, albeit with very modest growth expected.
- Chinese manufacturing activity expanded at the fastest pace since January, a sign that its economy continues to stabilize. In April, industrial production grew 3.9% year-over-year, the first positive reading so far this year and a definite improvement from the 13.5% and 1.1% declines seen in January/February and March, respectively. At the same time, fixed-asset investment and retail sales declined at slower rates in April, but continued to be negative.
- China was the only one of the top 10 markets for U.S.-manufactured goods to expand in May, returning to positive territory after pulling lower in April. In the previous month, most of the top 10 markets had contracted at paces that were either the worst since the Great Recession or at record lows. In May, seven of these economies saw improvements, albeit at rates of decline that remained quite severe.
- With economies around the world slowing materially due to COVID-19, there were very sharp reductions in trade in April.
- The U.S. trade deficit rose from $42.34 billion in March to $49.41 billion in April, an eight-month high. Goods exports dropped from $127.72 billion to $95.52 billion, the lowest point since September 2009. That change more than offset the decrease in goods imports, which declined from $193.74 billion to $167.35 billion, the weakest pace since October 2010.
- The underlying data reflect weaknesses in the economy and shifting trade patterns for airplanes, automobiles and parts, jewelry, machinery, metals and petroleum, pharmaceuticals and semiconductors and electronics, among other trends.
- In non-seasonally adjusted data, U.S.-manufactured goods exports totaled $334.71 billion through the first four months of 2020, dropping 10.25% from $372.92 billion for the same time frame in 2019.
- Service-sector trade volumes also declined dramatically, both for exports and imports, with the service-sector trade surplus decreasing from $23.69 billion to $22.43 billion.
- On the positive side, the petroleum trade surplus was the highest on record, at $3.22 billion.
- The U.S. dollar has fallen 2.5% against a broad-based index of currencies for goods and services since April 24, according to the Federal Reserve. The recent pullback reverses the trend seen earlier in the spring, when investors flocked to the U.S. dollar and dollar-denominated assets due to the COVID-19 pandemic. The current trend coincides with signs of improvements in economic activity.
- Manufacturers continue to advance efforts with the administration and Congress to ensure trade certainty and address challenges overseas, particularly amid the COVID-19 pandemic:
- Monitoring U.S.–China trade dynamics amid China’s actions on Hong Kong and the addition of the Chinese government and commercial bodies to Commerce’s Entity List
- Tracking United States–Mexico–Canada Agreement implementation preparations with entry into force expected on July 1
- Stressing the importance of U.S. leadership at the World Health Organization, following the U.S. announcement of plans to terminate its relationship with the WHO
- Securing a strong Miscellaneous Tariff Bill in 2020 to eliminate tariffs on products not produced or available in the United States
|
 |
|
| Global Economic Trends |
|
- Worldwide Manufacturing Activity: After dropping to its lowest point since March 2009, the J.P. Morgan Global Manufacturing PMI rebounded somewhat, rising from 39.6 in April to 42.4 in May. Overall, the sector continues to cope with severe operational and demand disruptions worldwide due to COVID-19, with activity still declining sharply despite some progress. The underlying data reflect that trend. Exports pulled back from an all-time low, with that index up from 27.1 to 32.2. Other measures also declined at slower rates, improving from paces not seen since the Great Recession. This included new orders (up from 31.5 to 36.3), output (up from 32.5 to 39.2) and employment (up from 41.5 to 43.2). Encouragingly, the index for future output (up from 47.1 to 52.1) returned to positive territory after falling below 50 for the first time since it was introduced in July 2012. This would suggest that manufacturers are cautiously upbeat for a rebound in production over the next six months, albeit with very modest growth.
- Global Outlook: The World Bank forecasts a decline of 5.2% in real global GDP in 2020, following 2.4% growth in 2019. It would be the worst decrease in worldwide growth since the aftermath of World War II, with global economies sharply pulling back on activity during the COVID-19 pandemic. Economists at the World Bank predict that real GDP will fall by 6.1% in the United States in 2020, with China growing by just 1%. The Eurozone will contract this year by a whopping 9.1%. With that said, the global economy should rebound in 2021, with worldwide growth jumping 4.2%. The U.S. economy is seen expanding by 4% next year, and Chinese growth should return to 6.9% growth. Europe is predicted to increase by 4.5% in 2021.
- Major Markets: China was the only one of the top 10 markets for U.S.-manufactured goods to expand in May, returning to positive territory after pulling lower in April. In the previous month, most of the top 10 markets had contracted at paces that were either the worst since the Great Recession or at record lows. In May, seven of these economies saw improvements, albeit at rates of decline that remained quite severe. Here are more details on each of these major markets (in order of their ranking for U.S.-manufactured goods exports in 2019):
- Canada : up from 33.0 in April, the worst reading since the survey began in October 2010, to 40.6 in May. Data improved across the board, but with overall activity still the second-lowest ever. Respondents were optimistic in their outlook for future output.
- Mexico: up from 35.0, a record low for a survey that began in April 2011, to 38.3. Demand and output improved from historic lows but continued to deteriorate sharply.
- China: up from 49.4 to 50.7, the best reading since January, with the strongest monthly gain in output (up from 51.1 to 54.0) since January 2011. New manufacturing orders and employment stabilized somewhat but remained negative. Exports (up from 33.7 to 41.7) improved in May after plunging at the fastest rate since December 2008 in April.
- Japan : down from 41.9 to 38.4, its worst reading since March 2009. New orders, output and hiring fell at the fastest paces since the Great Recession.
- United Kingdom: up from 32.6, the lowest reading in the survey’s 28-year history, to 40.7. New orders, output and exports recovered somewhat in May from jaw-dropping declines in April but still contracted severely. U.K. manufacturers are cautiously upbeat about future output, however, with that measure at a 3-month high.
- Germany: up from 34.5, the lowest point since March 2009, to 36.6. Demand, production and exports continued to deteriorate at sharp (but slower) rates. Hiring (down from 37.2 to 36.5) fell further, declining at its fastest pace since May 2009.
- Netherlands: down from 41.3 to 40.5, the largest deterioration in activity since April 2009. Very severe contractions occurred in demand, production and hiring in May, albeit with marginally slower rates of decline.
- South Korea: down from 41.6 to 41.3, its lowest level since January 2009. Employment fell at the fastest pace in the survey’s history, which dates to April 2004. New orders, output and exports improved slightly but continued to decline very sharply.
- Brazil: up from 36.0, a record low for a survey that began in February 2006, to 38.3, with progress across the board, even as activity remained the third-lowest ever. (The second-lowest reading was 38.1 in January 2009.)
- France: up from 31.5, an all-time low in the survey’s 22-year history, to 40.6. Demand, production and employment improved somewhat from record low rates but continued to deteriorate. Future output remained negative, albeit with expectations of declines that were better than the record low rate anticipated in April.
- Regional and National Trends: Much like the data discussed above, global manufacturing activity continued to be very weak in May despite some progress overall in April. China continues to see stabilization in its performance. Here are some other economic trends worth noting:
- China: There will be updates on Sunday night (early morning Chinese time on June 15) on May activity in China. In April, industrial production grew 3.9% year-over-year, the first positive reading so far this year and a definite improvement from the 13.5% and 1.1% declines seen in January/February and March, respectively. At the same time, fixed-asset investment (down 10.3% year-over-year) and retail sales (down 7.5% year-over-year) both declined at slower rates in April, but continued to indicate pullbacks in business and consumer spending despite some progress.
- Europe: Eurozone real GDP declined 3.6% in the first quarter, the worst quarterly decline in the history of the series, which dates to second quarter of 1995. In March, industrial production dropped 11.3%, led by very sizable decreases for capital goods, durable consumer goods, energy and intermediate goods. There will an update for April released on June 12, likely reflecting additional sharp reductions in output in the sector. Indeed, retail sales plunged 11.7% in April, building on the 11.1% decrease seen in March and led by sharp drops in food, non-food consumer items and automotive fuels spending. The unemployment rate edged up from 7.1% in March to 7.3% in April.
- United Kingdom: Retail sales plunged 18.1% in April, the largest monthly decline on record and building off of the 5.2% decline seen in March. Nonstore retailers were the lone bright spot, as Britons were limited to shopping from their homes in light of the COVID-19 outbreak. With new data for April coming out on June 12, industrial production was off 4.2% in March, the largest decline since February 1972. Manufacturing production was down by a sharp 9.7% year-over-year, illustrating the enormity of the pullback in activity in the sector during the pandemic.
- Canada: Real GDP fell 2.1% in the first quarter, or 8.2% at the annual rate, the steepest decline in 11 years. Sharp reductions in business and consumer spending in light of the COVID-19 pandemic led the declines. An update for April will be released on June 15. In March, manufacturing sales fell 9.2%, the largest monthly decline since December 2008. Likewise, retail sales plummeted by a record 10% in March, led by sharp decreases for clothing and accessories, gasoline stations and motor vehicle and parts. April retail spending data will be released on June 19. In May, the unemployment rate rose to 13.7%, passing the previous all-time high recorded in December 1982 (13.1%). There were 79,100 more manufacturing workers in May, but employment in the sector declined by 236,500 over the past year.
- Mexico: Real GDP fell 1.2% year-over-year in the first quarter, declining on a year-over-year basis for the fourth straight quarter. Industrial production for April will be released later this morning. In March, it fell 4.9% year-over-year, the biggest monthly decline since October 2010, with output in the manufacturing sector declining 6.4% over the past 12 months.
- Japan: Real GDP fell 0.6% in the first quarter, or a decline of 2.2% at the annual rate. The country has not seen positive growth since the second quarter of 2019. (The Japanese economy was flat in Q3:2019 and plummeted by 7.2% at the annual rate in Q4:2019.) Industrial production fell 9.1% in April, with a decline of 14.4% over the past year. May production data will be released on June 12.
- Emerging Markets: The IHS Markit Emerging Markets Manufacturing PMI increased from 42.7 in April, the lowest reading since January 2009, to 45.4 in May. Exports (up from 28.4 to 35.1) pulled back from the record low seen in April, declining at a slower rate, with new orders (up from 37.0 to 41.8) and output (up from 38.8 to 44.5) improving from their worst readings since the Great Recession. Encouragingly, the index for future output (up from 52.9 to 56.7) indicates some optimism for continued improvements in production over the next six months.
- Trade-Weighted U.S. Dollar Index: The U.S. dollar has fallen 2.5% against a broad-based index of currencies for goods and services since April 24, according to the Federal Reserve. The index reflects currency rates per U.S. dollar, suggesting the dollar can purchase somewhat less today than it could a few weeks ago. Overall, the recent pullback reverses the trend seen earlier in the spring, when investors flocked to the U.S. dollar and dollar-denominated assets due to the COVID-19 pandemic. The current trend coincides with signs of improvements in economic activity.
Yet, manufacturers continue to cite a strong dollar as a challenge, both to their earnings and for increasing international demand. Over a longer time horizon, the U.S. dollar has risen 11.8% since Feb. 1, 2018, with 27.8% growth since July 1, 2014.
- International Trade: The U.S. trade deficit rose from $42.34 billion in March to $49.41 billion in April, an eight-month high. With economies around the world slowing due to COVID-19, sharp reductions occurred in trade volumes. Goods exports dropped from $127.72 billion to $95.52 billion, the lowest point since September 2009. That change more than offset the decrease in goods imports, which declined from $193.74 billion to $167.35 billion, the weakest pace since October 2010. Service-sector trade volumes also declined dramatically, both for exports and imports, with the service-sector trade surplus decreasing from $23.69 billion to $22.43 billion. On the positive side, the petroleum trade surplus was the highest on record, at $3.22 billion.
The underlying data reflect weaknesses in the economy and shifting trade patterns for airplanes, automobiles and parts, jewelry, machinery, metals and petroleum, pharmaceuticals and semiconductors and electronics, among other trends.
In April, the sizable decrease in goods exports stemmed from significant reductions in non-automotive capital goods (down $10.12 billion), industrial supplies and materials (down $9.13 billion), automotive vehicles, parts and engines (down $7.37 billion to the lowest level since March 1992) and consumer goods (down $4.40 billion). For goods imports, the declines stemmed mainly from sharp decreases for automotive vehicles, parts and engines (down $14.56 billion), non-automotive capital goods (down $5.75 billion) and consumer goods (down $3.10 billion).
- U.S.-Manufactured Goods Exports: In non-seasonally adjusted data, U.S.-manufactured goods exports totaled $334.71 billion through the first four months of 2020, dropping 10.25% from $372.92 billion for the same time frame in 2019.
|
|
| International Trade Policy Trends |
|
- President Trump responds to China’s actions on Hong Kong with concrete measures but no changes to “phase one” trade deal. President Donald Trump on May 29 announced a series of measures in response to recent administration concerns with China, including visas, sanctions and steps to reassess the U.S.–Hong Kong relationship following the May 28 passage by China’s legislature of a legislative proposal for a new national security law in Hong Kong. Announced steps including the following:
- Termination of the United States’ relationship with the WHO and redirection of WHO contributions to other sources (see below)
- Launch of a new, not-yet-detailed process to eliminate “policy exemptions” that afford Hong Kong “different and special” treatment, including agreements on extradition, export controls, dual-use technology and Hong Kong’s status as a separate customs territory “with few exemptions”
- Planned imposition of sanctions on officials, likely in both China and Hong Kong, involved in efforts to undermine Hong Kong’s autonomy
- Other moves that the administration has already started to implement, including greater scrutiny of U.S.-listed Chinese companies, suspension of visas for those from China identified as potential security risks in relation to university research and revised Hong Kong travel guidance to highlight the increased risk of Chinese state security activities in the city
Despite these steps, President Trump made no mention of the “phase one” U.S.–China trade deal, and other senior U.S. officials have continued to tout progress made in the deal. The NAM strongly supported the “phase one” deal based on key commitments in areas such as intellectual property and dispute resolution, calling for robust implementation of its commitments as well as efforts to return to the negotiating table to begin negotiations on a “phase two” deal. Such further negotiations provide the only way to deal with unaddressed priorities and provide the pathway to step back from further trade war actions.
Learn more.
- Preparations Continue in Advance of July 1 USMCA Entry into Force.On June 3, the United States, Mexico and Canada released two sets of uniform regulations for the USMCA:
Previously, U.S. Customs and Border Protection issued USMCA Interim Implementing Instructions, which can be accessed here. The Interim Implementing Instructions are intended to be informational and provide early guidance on the new requirements under the USMCA, including information on claiming USMCA preferential treatment for goods. Final Implementing Instructions will be released prior to entry into force of the USMCA.
The NAM will continue working with policymakers in all three countries to ensure full implementation of the USMCA so that manufacturers can grow their business even more with our country’s two largest trading partners.
Learn more.
- The Office of the United States Trade Representative initiates new Section 301 investigations of digital services taxes. On June 2, the USTR announced the launch of investigations into digital services taxes that have been adopted or are being considered by Austria, Brazil, the Czech Republic, the European Union, India, Indonesia, Italy, Spain, Turkey and the United Kingdom.
- Click here to review the Federal Register notice for more details on the investigations, including a request for public comments by July 15.
Learn more.
- President Trump announces plans to “terminate relationship” with WHO. During his broader May 29 press conference announcing U.S. actions against China (see above), President Trump announced plans to formally end the U.S. relationship with the WHO, citing China’s “total control” over the organization.
- President Trump stated that the United States had issued a clear ultimatum to the WHO through his May 18 letter to WHO Director-General Dr. Tedros Adhanom Ghebreyesus that demanded “major substantive improvements within the next 30 days” and threatened to pull funding.
- In his May 29 press conference, President Trump stated that, because the United States had received no indication that WHO leadership was willing to engage on reform, the United States would terminate its relationship with the WHO and redirect funds to other sources.
- The timing and process surrounding a potential U.S. withdrawal from the WHO, as well as U.S. engagement in further conversations about WHO reform, both remain unclear at this point.
- The NAM, both directly and through its leadership in the cross-sector coalition Engaging America’s Global Leadership, has long stressed the importance of U.S. engagement and leadership at the WHO as well as clear priorities for WHO reform, transparency and accountability.
Learn more.
- MTB process advances with the United States International Trade Commission’s release of preliminary report, June public comment period. On June 9, the USITC sent to Congress a preliminary report on nearly 3,500 petitions for temporary tariff relief for the 2021–2023 period under the MTB.
- The USITC’s preliminary report includes determinations on domestic production and objections to MTB tariff relief by domestic producers, technical changes to the petitions and estimates of tariff revenue loss to the United States.
- From June 12 through 22, the USITC also will accept additional comments from the public on petitions for duty suspension and reductions not recommended for inclusion in the MTB in the preliminary report.
Learn more.
- Export-Import Bank will host a teleconference series about its new program on China and transformational exports. The Ex-Im Bank is hosting a series of virtual roundtables to facilitate stakeholder input on the bank’s role in advancing transformational exports in sectors like wireless communication, biotechnology, artificial intelligence, water treatment and sanitation, financial technologies, semiconductors and space technologies.
- The next call will take place on Thursday, June 11, at 3:00 p.m. EDT. The call will focus on artificial intelligence, high-performance and quantum computing. Click here to register. To learn more about the Ex-Im Bank’s program on China and transformational exports and to register for future sector-specific calls, please click here.
Learn more.
- Commerce tabs additional Chinese government, commercial bodies for export restrictions. In a pair of announcements released on May 22, the Department of Commerce’s Bureau of Industry and Security laid out plans to add more than 30 China-tied government and commercial entities to its Entity List.
- These announcements were followed by a final rule published in the Federal Register and effective on June 5 that added two dozen Chinese entities because of their ties to Chinese military activities and actions contrary to the national security or foreign policy interests of the United States. The entities included software company Qihoo 360 and cloud service provider CloudMinds. Any company seeking to sell any items subject to the Export Administration Regulations will now require a license from BIS for these listed entities.
- Also on June 5, a final rule went into effect that adds nine entities that have been implicated in human rights violations and abuses against Uighurs and others in western China’s Xinjiang province. Added entities included surveillance companies CloudWalk Technology and textile company Aksu Huafu Textiles. For this rule, BIS is imposing a license requirement for all items subject to EAR and a license review policy mandating case-by-case review for specific Export Control Classification Numbers listed in the rule.
- This move follows the addition over the last two years of additional Chinese governmental organizations and companies to this list, including the May 2019 addition of Huawei (and additional entities in August 2019) and the October 2019 addition of Hikvision.
Learn more.
- Manufacturers seek clarity and guidance on new BIS export restrictions on China, Russia and Venezuela. On April 28, BIS published a final rule expanding export controls for military end use or military end users in China, Russia and Venezuela. The rule will be effective on June 29.
- As a broad range of manufacturers is likely to be impacted by this expansion, the NAM is seeking further clarity and guidance from BIS to ensure the rule both effectively upholds national security and considers U.S. competitiveness and compliance challenges.
- BIS would like to hear from individual companies regarding questions and areas where clarification is needed. If you are inclined to share your company’s feedback, contact BIS here or call (202) 482-0092.
Learn more.
- USTR releases U.S.–Kenya Trade Agreement negotiating objectives. On May 22, the USTR released a final summary of U.S.–Kenya Trade Agreement negotiating objectives.
- In the summary, USTR underscores its commitment to “strengthen our economic relationship with Kenya and lay the foundations for stronger, more resilient economies to address the current and future health crises” and “address both tariff and non-tariff barriers and to achieve fairer, more balanced trade.”
- The summary addresses priorities for manufacturers, including but not limited to trade in goods, sanitary and phytosanitary measures, customs and trade facilitation, rules of origin, technical barriers to trade, digital trade, investment, intellectual property and government procurement.
Learn more.
- Commerce Department announces new Section 232 investigation on imports of vanadium. On June 2, the Commerce Department initiated a Section 232 investigation into whether imports of vanadium into the United States threaten to impair U.S. national security.
- In a press release, Secretary of Commerce Wilbur Ross said that “vanadium is utilized in our national defense and critical infrastructure, and is integral to certain aerospace applications” and that “we will conduct a thorough, fair, and transparent investigation to determine whether vanadium imports threaten to impair U.S. national security.”
- In a June 3 Federal Register notice, Commerce has requested comments by July 20 and rebuttal comments by Aug. 17 (in response to issues raised in comments submitted by July 20).
Learn more.
|
|
| Take Action |
|
- Stop Fakes Roadshow
Detroit, Michigan
September 15, 2020
This roadshow delivers important information about intellectual property to the audience that needs it most: start-ups, entrepreneurs, small and medium-sized businesses, independent creators and inventors. Experts from multiple government agencies that deal with intellectual property issues present the information. Learn more.
- For a listing of upcoming U.S. Trade and Development Agency missions, click here.
- For a listing of upcoming Commerce Department trade missions, click here.
|
|
Thank you for subscribing to the NAM’s Global Manufacturing Economic Update.
If you’re part of an NAM member company and not yet subscribed, email us. If you’re not an NAM member, become one today!
|
|
|
|
|
|
|
|
|
|
|

