 |
| If you’re having trouble reading this, click here. |
 |
|
|
|
| MONDAY ECONOMIC REPORT |
| Essential Takes on Leading Economic Indicators |
|
| By Chad Moutray, Ph.D., CBE – November 26, 2018 |
|
|
|
|
Housing Market Struggles Persist
in Latest Data |
|
| The Weekly Toplines |
|
- The latest data show housing market struggles persisting, with activity much weaker in the second half of 2018 than the rates earlier in the year. Affordability (e.g., higher mortgage rates, increased raw material costs) and workforce issues have taken a toll on demand, but weather has also played a role of late. Along those lines, Freddie Mac reported that the average interest rate for a 30-year fixed-rate mortgage was 4.94 percent on November 15, the highest mortgage rate since February 24, 2011.
- With that in mind, homebuilder confidence declined in November to the lowest level in more than two years. In a similar way, existing home sales remain very soft in every region of the country, down 5.1 percent year-over-year in October, despite rising in the latest month for the first time since March.
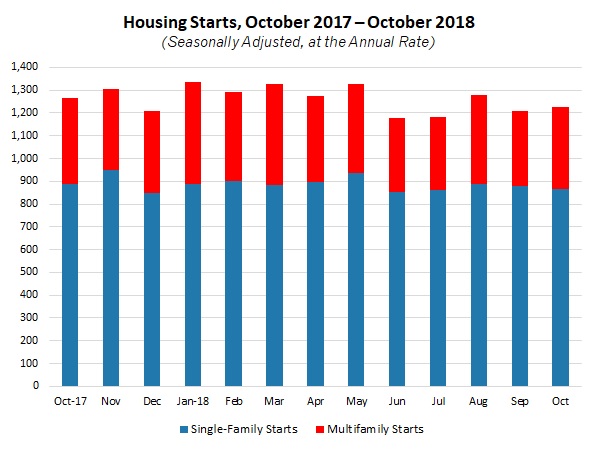
- Housing starts rose 1.5 percent in October, up from an annualized 1,210,000 units in September to 1,228,000 units in October mainly for multifamily units, which can be highly volatile from month to month. Single-family starts decreased for the second straight month. On a year-over-year basis, housing starts fell 2.9 percent.
- Housing permits also declined, down 0.6 percent from 1,270,000 units at the annual rate in September to 1,263,000 units in October, with slightly reduced activity for both single-family and multifamily units. To the extent that permits are a proxy of future activity, the data provide mixed comfort, suggesting a faster pace than the current figures but off from the rates earlier in the year (which regularly exceeded 1.3 million units).
- New durable goods orders were disappointing, falling 4.4 percent in October, largely on significant declines in aircraft sales, which can be highly volatile from month to month. Excluding transportation, new orders edged up 0.1 percent in October. Core capital goods, which are often seen as a proxy of capital spending in the U.S. economy, were unchanged for the month and have drifted lower since reaching an all-time high in July. With that said, the longer-term trend for these measures remains encouraging, with new orders for durable goods jumping 6.7 percent since October 2017.
- Consumer confidence slipped again in November, according to the University of Michigan and Thomson Reuters, on income concerns, even as they continue to suggest Americans are upbeat overall. This could reflect recent stock market volatility, among other things. Along those lines, the Dow Jones Industrial Average has erased its gains for 2018 with declines last week, with the index down more than 8 percent from the all-time high recorded on October 3.
|
|
 |
|
| Economic Indicators |
|
Last Week's Indicators:
(Summaries Appear Below)
Monday, November 19
NAHB Housing Market Index
Tuesday, November 20
Housing Starts and Permits
Wednesday, November 21
Conference Board Leading Indicators
Durable Goods Orders and Shipments
Existing Home Sales
University of Michigan Consumer Sentiment
Thursday, November 22
THANKSGIVING DAY
Friday, November 23
None
|
|
|
|
This Week's Indicators:
Monday, November 26
Chicago Fed National Activity Index
Dallas Fed Manufacturing Survey
Tuesday, November 27
Conference Board Consumer Confidence
Wednesday, November 28
Gross Domestic Product (Revision)
International Trade in Goods (Preliminary)
New Home Sales
Richmond Fed Manufacturing Survey
Thursday, November 29
Personal Income and Spending
Friday, November 30
None
|
|
|
| Deeper Dive |
|
- Conference Board Leading Indicators: The Leading Economic Index (LEI) inched up 0.1 percent in October, the slowest monthly gain since May after rising 0.6 percent in September. At the same time, this report continued to reflect a U.S. economic outlook that is growing modestly, with the LEI up 2.8 percent over the past six months. New orders for manufactured goods were bright spots in October, with consumer confidence, the interest rate spread and overall lending conditions also making positive contributions to the LEI. Meanwhile, the Coincident Economic Index increased 0.2 percent in October, with all subcomponents helping to boost that measure, including industrial production.
- Durable Goods Orders and Shipments: New durable goods orders fell 4.4 percent in October, but much of that decline came from large declines in aircraft orders, which can often be highly volatile from month to month. Excluding transportation, new durable goods orders edged up 0.1 percent in October. Disappointingly, new orders for core capital goods (or nondefense capital goods excluding aircraft)—a proxy for capital spending in the U.S. economy—were unchanged in October at $69.4 billion, with that measure drifting lower since reaching an all-time high in July ($69.9 billion). This suggests some softness in capital spending in the economy.
Nonetheless, the longer-term trend remains positive, even with data that have been weaker than desired in the past few months. New orders for durable goods have jumped 6.7 percent over the past 12 months, or 4.5 percent year-over-year with transportation excluded. Core capital goods orders rose 3.4 percent year-over-year. Meanwhile, shipments of durable goods fell 0.6 percent in October, but up 0.1 percent with transportation excluded. Since October 2017, durable goods shipments have risen a solid 6.8 percent, or 5.4 percent with transportation excluded.
- Existing Home Sales: The National Association of Realtors® (NAR) reported that existing home sales increased for the first time since March, rising 1.4 percent in October to 5.22 million units. The only region with decreasing sales in October was the Midwest. Despite the higher monthly data, existing home sales remain well below the 5.60 million units in March, reflecting ongoing challenges in the housing market. Sales have fallen 5.1 percent over the past 12 months, with declines in every region of the country. Inventories of homes for sale remain elevated at 4.3 months of supply on the market in October, up from 3.5 months in March. The median sales price for existing homes rose 3.8 percent year-over-year in October to $255,400.
- Housing Starts and Permits: The new residential construction data for October provided some good news, mainly for multifamily activity. However, the housing market remained challenged overall. Housing starts rose 1.5 percent, up from an annualized 1,210,000 units in September to 1,228,000 units in October. The monthly increase came from the more volatile multifamily segment, up from 329,000 to 363,000. On a more discouraging note, single-family starts declined for the second straight month, down from 881,000 to 865,000. This is consistent with other data showing softness in the housing market, largely due to affordability (e.g., higher mortgage rates, increased raw material costs) and workforce issues. Weather might have also played a factor, especially in the Northeast and South. On a year-over-year basis, housing starts fell 2.9 percent.
The housing permits data decreased slightly, down from 1,270,000 units at the annual rate in September to 1,263,000 units in October. Single-family and multifamily activity both declined marginally for the month. To the extent that permits are a proxy of future activity, the data provide mixed comfort, suggesting a faster pace than the current figures but off from the rates earlier in the year (which regularly exceeded 1.3 million units). Over the past 12 months, housing permits have fallen 6.0 percent, with single-family activity off 0.6 percent year-over-year.
- NAHB Housing Market Index: The National Association of Home Builders reported that confidence fell to the lowest level in more than two years in November. The Housing Market Index dropped from 68 in October to 60 in November. This continued to suggest strong growth, with the headline index at 60 or greater for 27 straight months, but that optimism dropped largely on weaker demand, with affordability and workforce challenges often cited as the biggest concerns. Yet, it is important to note that builders remained upbeat about single-family sales over the next six months, albeit with that measure declining from 75 to 65 in the latest report.
- University of Michigan Consumer Sentiment: The Index of Consumer Sentiment declined from 98.6 in October to 97.5 in November. This was lower than the preliminary estimate of 98.3 reported a few weeks earlier. Americans’ assessments of current and future economic conditions slipped in the latest survey, largely on income concerns, according to the press release. This could reflect stock market volatility, among other things. Even as the public’s perceptions about the economy have eased since March’s reading (101.4), which was the highest since January 2004, the data remain upbeat overall.
|
|
Thank you for subscribing to the NAM’s Monday Economic Report.
If you’re part of an NAM member company and not yet subscribed, email us. If you’re not an NAM member, become one today!
|
|
|
|
|
|
|
|
|
|
|
|
