 |
| If you’re having trouble reading this, click here. |
|
| MONDAY ECONOMIC REPORT |
|
|
|
|
| Essential Takes on Leading Economic Indicators |
|
By Chad Moutray, Ph.D., CBE – April 29, 2019– SHARE


|
|
<
|
|
|
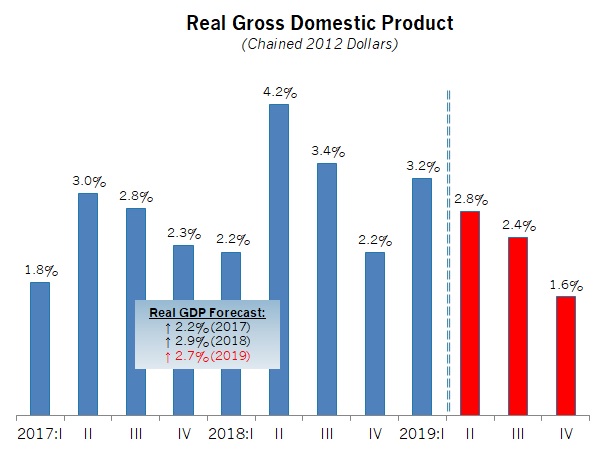
U.S. Economy Showed Its Resilience in the First Quarter, Growing 3.2 Percent |
|
| The Weekly Toplines |
|
- Despite a multitude of challenges—slowing global growth, the partial government shutdown, trade policy uncertainties, a strong U.S. dollar—the U.S. economy showed its resilience in the first quarter, growing a solid 3.2 percent at the annual rate. This was the strongest first quarter of growth since 2015.
- The data were buoyed by robust contributions from service-sector consumption, exports and state and local government spending, with notable drags on growth from durable goods spending and housing. Weaker consumer purchases stemmed largely from sharp declines in motor vehicles and parts activity, among other categories.
- Nonetheless, the larger story here remains the strength in the top-line number, which exceeded consensus estimates and was significantly better than what was predicted just a few weeks ago. As such, the U.S. economy should now expand by around 2.7 percent in 2019—an improvement from what I might have forecasted prior to this release.
- New durable goods orders rebounded strongly, up 2.7 percent in March after falling 1.1 percent in February. In addition, new orders for core capital goods—a proxy for capital spending in the U.S. economy—increased 1.3 percent in March to a new all-time high of nearly $70.0 billion. Overall, new durable goods orders have increased 2.3 percent over the past 12 months, with new orders excluding transportation equipment and core capital goods orders up 2.9 percent and 5.1 percent year-over-year, respectively.
- The two regional surveys out last week suggested a continued expansion in manufacturing activity, both in the Kansas City and Richmond Federal Reserve Bank districts, but at a softer pace. More importantly, the outlook for the next six months remained positive.
- The housing market data provided mixed results. Encouragingly, new single-family home sales rose for the third consecutive month, up from 662,000 units in February to 692,000 units in March. This was the best monthly reading since November 2017, with reduced mortgage rates likely helping to boost demand. Nonetheless, existing home sales were down 4.9 percent in March, even as the outlook for the next six months would suggest a rebound is likely.
- According to the latest Business Employment Dynamics data, which typically come out with a two-quarter lag, there were 5,000 manufacturing start-ups in the third quarter, or a rate of 1.6 percent of all establishments in the sector. Those new establishments (or “births”) employed 24,000 workers. The pace of manufacturing start-ups has been relatively flat for about a decade, and notably, entrepreneurship in the sector (as well as economy-wide) has slowed from the rates in the 1990s and early 2000s.
|
 |
|
| Economic Indicators |
|
Last Week's Indicators:
(Summaries Appear Below)
Monday, April 22
Chicago Fed National Activity Index
Existing Home Sales
Tuesday, April 23
New Home Sales
Richmond Fed Manufacturing Survey
Wednesday, April 24
Business Employment Dynamics
Thursday, April 25
Durable Goods Orders and Shipments
Kansas City Fed Manufacturing Survey
Friday, April 26
Gross Domestic Product
University of Michigan Consumer Sentiment (Revised)
|
|
|
|
This Week's Indicators:
Monday, April 29
Dallas Fed Manufacturing Survey
Personal Consumption Expenditures Deflator
Personal Income and Spending
Tuesday, April 30
Conference Board Consumer Confidence
Employment Cost Index
Wednesday, May 1
ADP National Employment Report
Construction Spending
FOMC Monetary Policy Statement
ISM® Manufacturing Purchasing Managers’ Index®
Thursday, May 2
Factory Orders and Shipments
Productivity and Costs
Friday, May 3
BLS National Employment Report
International Trade in Goods (Preliminary)
|
|
|
| Deeper Dive |
|
- Business Employment Dynamics: Net employment growth rose by just 27,000 in the third quarter of 2018, slowing from the gain of 437,000 in the second quarter. Manufacturers had gross job gains of 419,000 in the third quarter, with 380,000 from expanding establishments and 39,000 from new establishments. At the same time, there were gross job losses of 409,000 in the third quarter, with 363,000 from contracting establishments and 46,000 from closing establishments. Therefore, there was a net employment change of 10,000 more workers in the manufacturing sector in the third quarter, easing from the net gain of 63,000 in the second quarter.
In addition, there were 5,000 manufacturing start-ups in the third quarter, or a rate of 1.6 percent of all establishments in the sector. Those new establishments (or “births”) employed 24,000 workers. The pace of manufacturing start-ups has been relatively flat for about a decade, and notably, entrepreneurship in the sector (as well as economy-wide) has slowed from the rates in the 1990s and early 2000s.
- Chicago Fed National Activity Index: The Chicago Federal Reserve Bank reported that the U.S. economy continued to show weaknesses in March, with the National Activity Index in negative territory for the third straight month. With that said, the headline index was less negative in the latest data, up from -0.31 in February to -0.15 in March. Index values above zero are consistent with economic growth that is above trend and vice versa. Production-related indicators provided a drag on growth in March, with manufacturing production essentially unchanged for the month.
- Durable Goods Orders and Shipments: New durable goods orders rebounded strongly, up 2.7 percent in March after falling 1.1 percent in February. With that said, defense and nondefense aircraft and parts orders, which can be highly volatile from month to month, both rose sharply in March, with motor vehicles and parts orders up 2.1 percent. Excluding transportation, new durable goods orders rose 0.4 percent in March, improving after edging down 0.2 percent in February. Other bright spots included stronger demand for computers and electronic products, electrical equipment, appliances and components, machinery and other durable goods. In addition, new orders for core capital goods (or nondefense capital goods excluding aircraft)—a proxy for capital spending in the U.S. economy—increased 1.3 percent in March to a new all-time high of nearly $70.0 billion.
The longer-term trend reflects modest growth. New durable goods orders have increased 2.3 percent over the past 12 months, with new orders excluding transportation equipment and core capital goods orders up 2.9 percent and 5.1 percent year-over-year, respectively. Meanwhile, durable goods shipments rose 0.3 percent in the latest report. Since March 2018, durable goods shipments have risen a healthy 5.1 percent, or 4.0 percent excluding transportation.
- Existing Home Sales: The National Association of Realtors reported that existing home sales fell 4.9 percent, down from an annualized 5.48 million units in February to 5.21 million units in March. Sales declined in every region of the country in March, with single-family and co-op sales off 4.9 percent and 5.3 percent, respectively, for the month. NAR Chief Economist Lawrence Yun said, “It is not surprising to see a retreat after a powerful surge in sales in the prior month. Still, current sales activity is underperforming in relation to the strength in the jobs markets. The impact of lower mortgage rates has not yet been fully realized.”
Over the past 12 months, existing home sales decreased 5.4 percent, down from 5.51 million units in March 2018. There were 3.9 months of supply on the market in the latest figures, up from 3.6 months in February. The median sales price for existing homes rose 3.8 percent year-over-year in March to $259,400.
- Gross Domestic Product: Despite a multitude of challenges—slowing global growth, the partial government shutdown, trade policy uncertainties, a strong U.S. dollar—the U.S. economy showed its resilience in the first quarter, growing a solid 3.2 percent at the annual rate. This was the strongest first quarter of growth since 2015. The data were buoyed by robust contributions from service-sector consumption, exports and state and local government spending, with notable drags on growth from durable goods spending and housing. Weaker consumer purchases stemmed largely from sharp declines in motor vehicles and parts activity, among other categories.
Nonetheless, the larger story here remains the strength in the top-line number, which exceeded consensus estimates and was significantly better than what was predicted just a few weeks ago. As such, the U.S. economy should now expand by around 2.7 percent in 2019—an improvement from what I might have forecasted prior to this release. As a reminder, real GDP rose 2.9 percent in 2018, or 3.1 percent from Q4:2017 to Q4:2018. The was the best year-over-year rate since 2005.
In the first quarter figures, goods consumption declined 0.7 percent at the annual rate, weighed down by a whopping 5.3 percent decrease in durable goods spending (see the motor vehicles discussion above) but helped by a 1.7 percent increase for nondurable goods activity. I would expect automotive sales to improve moving forward, which should help boost second quarter growth. At the same time, nonresidential fixed investment rose a modest 2.7 percent, largely on intellectual property spending. Equipment and structures investment was soft, but business spending on inventories added 0.65 percentage points to headline growth.
Meanwhile, goods exports rose an annualized 4.7 percent in the first quarter, with goods imports off 4.4 percent. Therefore, net exports added 1.03 percentage points to real GDP growth, the strongest contribution since the second quarter of 2018.
- Kansas City Fed Manufacturing Survey: Manufacturing activity continued to expand softly in April despite slowing from March’s pace (and stronger growth last year). The composite index eased from 10 in March to 5 in April, with slower growth in shipments, production and employment. Yet, new orders and exports accelerated somewhat, which was encouraging. Respondents cited workforce and weather as challenges in the sample comments. Meanwhile, manufacturers remained positive about activity over the next six months, but that optimism declined to the lowest level since September 2016. Still, 42 percent of manufacturing firms in the district predict increased orders in the coming months, with 33 percent and 38 percent seeing accelerated hiring and capital spending growth, respectively. As such, the outlook continued to be promising.
- New Home Sales: New single-family home sales rose for the third consecutive month, up from 662,000 units in February to 692,000 units in March. This was the best monthly reading since November 2017, with reduced mortgage rates likely helping to boost demand. Sales increased in every region of the country except the Northeast. Over the past 12 months, new home sales have risen a modest 3.0 percent, up from 672,000 in March 2018. This represents progress from the negative year-over-year pace in recent months. The housing market remains challenged by increased construction costs and worker shortages despite better data year to date in 2019.
With the uptick in sales, there were 6.0 months of supply on the market in March, notable progress from the 7.4 months of supply in December. The median sales price was $302,700, down 9.7 percent from one year ago.
- Richmond Fed Manufacturing Survey: Manufacturing activity expanded for the third straight month in the district but slowed somewhat in April. The composite index of general business activity declined from 10 in March to 3 in April, pulled lower by reduced new orders, shipments and capacity utilization. Employment eased slightly as well, but continued to grow at healthy rates, with firms once again citing an inability to find sufficient talent and with a solid pace of wage appreciation. In April, capital expenditures improved, which was encouraging. Moreover, survey respondents remained optimistic about further expansion over the next six months, with accelerated activity predicted for sales, shipments and capital spending.
Raw material costs rose 3.04 percent at the annual rate in April, up from 2.84 percent in March. This suggests elevated rates of growth for input costs, even as raw material prices have moderated from several months ago. Moving forward, manufacturers see raw material prices rising by an annualized 2.45 percent six months from now, up from 2.10 percent in March but indicating some stabilization from the current pace.
- University of Michigan Consumer Sentiment: The Index of Consumer Sentiment pulled back somewhat in the latest data, down from 98.4 in March to 97.2 in April. Americans felt more upbeat in the latest survey about current economic conditions, but the drop in the headline index stemmed from a weakened assessment in future expectations. Despite some easing, however, consumers continued to be mostly optimistic, with the longer-term trendline remaining favorable. This data is consistent with 2.5 percent growth in real consumer spending in 2019.
|
|
|
|
|
|
|
|
|
|
|

