 |
| If you’re having trouble reading this, click here. |
|
| MONDAY ECONOMIC REPORT |
|
|
|
|
| Essential Takes on Leading Economic Indicators |
|
By Chad Moutray, Ph.D., CBE – May 6, 2019 – SHARE


|
|
<
|
|
|
Strong Labor Market in April, but with Soft Manufacturing Job Growth |
|
| The Weekly Toplines |
|
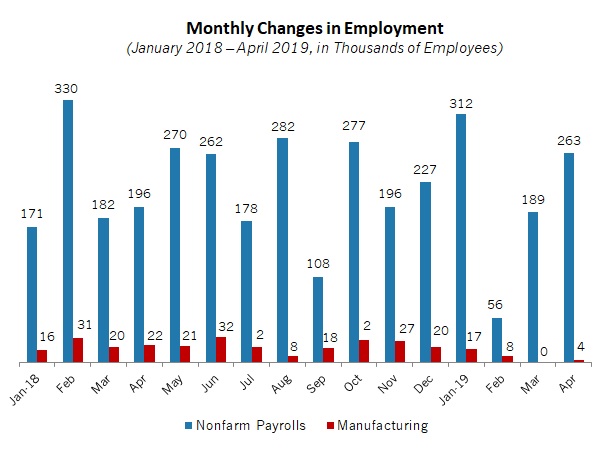
- Manufacturing employment rose by 4,000 workers in April, bouncing back from being unchanged in March. Despite the positive reading, one cannot help but be disappointed by the softer job growth over the past three months, but it also coincides with weaker-than-desired demand and production figures. Moving forward, a pickup in monthly employment growth would be anticipated, especially given the rebounds experienced in several other economic indicators.
- Still, even with some recent softness, manufacturers have added 17,000 workers per month over the past 12 months, a solid rate overall, and there were 12,838,000 employees in the sector in April, the most since December 2008.
- Nonfarm payrolls increased by a stronger-than-anticipated 263,000 workers in April. Overall, the labor market remains extremely tight, with the unemployment rate falling from 3.8 percent in March to 3.6 percent in April, the lowest rate since December 1969.
- Private manufacturing wages and salaries jumped 0.9 percent in the first quarter. That translated into 2.9 percent growth over the past 12 months, the fastest year-over-year pace of growth since the second quarter of 2003. For all private-sector employees, wages and salaries rose 0.7 percent in the first quarter, the same as the fourth quarter, or 3.0 percent year-over-year.
- The Institute for Supply Management® reported that manufacturing activity expanded at the slowest pace since October 2016 in April, with softening new orders, production and employment for the month. Exports contracted, however, for the first time since February 2016, which likely weakened total demand. The sample comments indicate that trade anxieties, especially related to the Mexican border and Brexit, were front and center in respondents’ minds.
- New orders for manufactured goods rose 1.9 percent in March, bouncing back from a decrease of 0.3 percent in February. Excluding transportation equipment, factory orders increased 0.8 percent in March, up from 0.3 percent in February. Overall, factory orders rose a modest 2.0 percent year-over-year. In addition, new orders for core capital goods increased 1.4 percent in March to a new all-time high, which suggests that capital spending growth has been healthy.
- Moreover, private manufacturing construction spending increased 2.5 percent to $70.18 billion in March, the best reading for manufacturing construction since December 2016. This is welcome news, consistent with the stronger economic outlook for the sector.
- Personal consumption expenditures jumped 0.9 percent in March, soaring after a soft 0.1 percent gain in February. Encouragingly, personal spending has risen 4.4 percent year-over-year, with indications that Americans have once again started to open their pocketbooks. The saving rate is more evidence of this, with the rate plummeting from 7.7 percent in December to 6.5 percent in March.
- The PCE deflator rose 0.2 percent in March, the fastest rate of increase since October, largely on higher energy costs, up 3.6 percent. At the same time, the core PCE deflator, which excludes food and energy prices, was flat in March. Over the past 12 months, the PCE deflator has risen 1.5 percent, up from 1.3 percent in February, the slowest year-over-year pace since September 2016. Core inflation inched down from 1.7 percent year-over-year in February to 1.6 percent in March, the lowest reading since January 2018.
- Overall, the data continue to suggest that price growth has moderated substantially over the past nine months. This should provide some comfort to the Federal Open Market Committee, as it should allow the committee the luxury of being more “dovish” in setting monetary policy over the coming months in 2019.
- Along those lines, the FOMC did not make any changes to monetary policy after its April 30 – May 1 meeting. Most analysts, including me, do not expect the Federal Reserve to raise (or lower) interest rates in 2019. With that said, the FOMC remains data dependent and might change that thinking if economic conditions warrant a change.
|
 |
|
| Economic Indicators |
|
Last Week's Indicators:
(Summaries Appear Below)
Monday, April 29
Dallas Fed Manufacturing Survey
Personal Consumption Expenditures Deflator
Personal Income and Spending
Tuesday, April 30
Conference Board Consumer Confidence
Employment Cost Index
Wednesday, May 1
ADP National Employment Report
Construction Spending
FOMC Monetary Policy Statement
ISM® Manufacturing Purchasing Managers’ Index®
Thursday, May 2
Factory Orders and Shipments
Productivity and Costs
Friday, May 3
BLS National Employment Report
International Trade in Goods (Preliminary)
|
|
|
|
This Week's Indicators:
Monday, May 6
None
Tuesday, May 7
Consumer Credit
Job Openings and Labor Turnover Survey
Wednesday, May 8
None
Thursday, May 9
International Trade Report
Producer Price Index
Friday, May 10
Consumer Price Index
|
|
|
| Deeper Dive |
|
- ADP National Employment Report: Manufacturers added 5,000 workers in April, according to ADP estimates. In March, there had been a loss of 6,000 employees, the first decline since December 2016. Despite the rebound, manufacturing employment has been softer than desired lately, pulling the monthly average for the past 12 months down to 13,633. It had been nearly 18,000 per month as recently as December. Meanwhile, total nonfarm private employment rose a solid 275,000 in April, the best monthly reading since July. The U.S. economy has generated a very healthy 222,716 workers per month since April 2018—a sign of continued strength in the overall labor market. In addition, more than 80 percent of the net new jobs created in April came from small and medium-sized businesses.
- BLS National Employment Report: Manufacturing employment rose by 4,000 workers in April, bouncing back from being unchanged in March. (This was an improvement, as March was previously estimated to be a decline of 6,000 workers.) Despite the positive reading, one cannot help but be disappointed by the softer job growth over the past three months, but it also coincides with weaker-than-desired demand and production figures. Moving forward, a pickup in monthly employment growth would be anticipated, especially given the rebounds experienced in several other economic indicators. In addition, firms continue to cite a difficulty in obtaining talent as a top concern, with elevated job openings data.
Still, even with some recent softness, manufacturers have added 17,000 workers per month over the past 12 months, a solid rate overall, and there were 12,838,000 employees in the sector in April, the most since December 2008.
In the larger economy, nonfarm payrolls increased by a stronger-than-anticipated 263,000 workers in April. Overall, the labor market remains extremely tight, with the U.S. economy generating 218,333 workers per month over the past 12 months. Moreover, the unemployment rate fell from 3.8 percent in March to 3.6 percent in April, the lowest rate since December 1969, and the so-called “real unemployment rate” stayed at 7.3 percent in this report for the third straight month, continuing to be the lowest since March 2001.
If there were any weaknesses in the report, it was the participation rate, which has declined from 63.2 percent in February, to 63.0 percent in March, to 62.8 percent in April, a seven-month low. As such, the unemployment rate declined “for the wrong reasons”—as more Americans left the job market, at least temporarily.
- Conference Board Consumer Confidence: Consumer sentiment bounced back in April, continuing the seesawing in recent months, with the headline index up from 124.2 in March to 129.2 in April. While this measure has pulled back since reaching the highest level since September 2000 in October (137.9), Americans continued to be mostly positive overall. In the latest data, the percentage of respondents suggesting that business conditions were “good” increased from 34.7 percent to 37.3 percent, with those noting that conditions were “bad” declining from 12.4 percent to 11.7 percent. Moreover, the percentage of Americans feeling jobs were “plentiful” increased from 42.5 percent to 46.8 percent, with those responding that jobs were “hard to get” dropping from 13.8 percent to 13.3 percent.
- Construction Spending: Private manufacturing construction spending increased 2.5 percent in the latest data, up from $68.49 billion at the annual rate in February to $70.18 billion in March. That was the best reading for manufacturing construction since December 2016, and it represents steady progress since falling to the lowest level since September 2014 in May ($60.77 billion). This is welcome news, consistent with the stronger economic outlook for the sector. Along those lines, the value of construction put in place in manufacturing has jumped 10.9 percent from one year ago, with $63.26 billion in construction spending in the sector in March 2018. Nonetheless, manufacturing construction activity remains below the all-time high of $82.1 billion in May 2015.
Meanwhile, total construction spending fell 0.9 percent in March, with private residential and public-sector spending down 1.8 percent and 1.3 percent, respectively. Private, single-family housing activity declined 1.5 percent for the month, with a year-over-year decline of 8.2 percent. At the same time, private-sector nonresidential construction rose 0.5 percent in March, increasing by a modest 2.1 percent over the past 12 months.
- Dallas Fed Manufacturing Survey: While the composite index of general business activity declined from 6.9 in March to 2.0 in April, the underlying data reflected improving growth in new orders, production, shipments, capacity utilization and capital expenditures in the latest survey. Hiring slowed a bit, but wages and benefits continued to expand strongly. Overall, manufacturers in the Texas district remained optimistic about the next six months, albeit with some easing in April. At least 43 percent see increased sales, output and shipments moving forward. In addition, 39.5 percent forecast more hiring, and 30.9 percent anticipate additional capital investments over the coming months.
In a special question, 57.0 percent of firms responding to this and other business surveys said they were increasing capital investments because of reduced taxes in 2018. In addition, those firms were also raising wages (44.6 percent), paying down debt or increasing savings (37.2 percent) and paying bonuses (25.6 percent), among other options.
- Employment Cost Index: Private manufacturing wages and salaries jumped 0.9 percent in the first quarter, extending the solid 0.8 percent gain in the fourth quarter. That translated into 2.9 percent growth over the past 12 months, the fastest year-over-year pace of growth since the second quarter of 2003. For all private-sector employees, wages and salaries rose 0.7 percent in the first quarter, the same as the fourth quarter, or 3.0 percent year-over-year.
Benefits costs for manufacturing employees also increased 0.9 percent in the first quarter, but on a year-over-year basis, benefits have risen a modest 1.1 percent over the past 12 months. As a result, total manufacturing compensation increased 0.9 percent for the quarter, but has risen 2.2 percent year-over-year.
- Factory Orders and Shipments: New orders for manufactured goods rose 1.9 percent in March, bouncing back from a decrease of 0.3 percent in February. Significant gains occurred in the highly volatile defense and nondefense aircraft and parts segment, and motor vehicle and parts sales rose 1.5 percent, the strongest increase so far this year. Excluding transportation equipment, factory orders increased 0.8 percent in March, up from 0.3 percent in February. Overall, factory orders rose a modest 2.0 percent year-over-year, or with a 2.1 percent gain since March 2018 with transportation equipment excluded.
In addition, new orders for core capital goods (or nondefense capital goods excluding aircraft)—a proxy for capital spending in the U.S. economy—increased 1.4 percent in March to a new all-time high of $69.98 billion. Over the past 12 months, core capital goods spending has increased a solid 5.1 percent.
Meanwhile, shipments rose 0.7 percent in March, extending the 0.5 percent increase in February. Since March 2018, manufactured goods shipments increased 3.5 percent, with a gain of 2.7 percent over the past 12 months with transportation excluded.
- FOMC Monetary Policy Statement: As expected, the Federal Open Market Committee did not make any changes to monetary policy after its April 30 – May 1 meeting. Participants said that “the labor market remains strong and that economic activity rose at a solid rate,” but consumer and business spending slowed in the first quarter of 2019. In addition, pricing pressures have moderated, with core inflation pulling below the Federal Reserve’s stated 2 percent goal. As a result, the target range for the federal funds rate remained at 2.25 to 2.50 percent. Indeed, most analysts, including me, do not expect the Federal Reserve to raise (or lower) interest rates in 2019. With that said, the FOMC remains data dependent and might change that thinking if economic conditions warrant a change.
- International Trade in Goods (Preliminary): In advance statistics, the goods trade deficit increased from $70.94 billion in February to $71.45 billion in March. This was the result of a rise in goods imports (up $1.95 billion) that exceeded the increase in goods exports (up $1.45 billion). The gains in exports came largely from industrial supplies; foods, feeds and beverages; and other goods. Final data will be released May 9, which will also include the service-sector trade surplus.
- ISM® Manufacturing Purchasing Managers’ Index®: The Institute for Supply Management® reported that manufacturing activity expanded at the slowest pace since October 2016 in April. The composite index declined from 55.3 in March to 52.8 in April, with softening new orders, production and employment for the month. Exports contracted, however, for the first time since February 2016, which likely weakened total demand. Imports also contracted, which had not happened since January 2017, suggesting that overall trade volumes were lower. The sample comments indicate that trade anxieties, especially related to the Mexican border and Brexit, were front and center in respondents’ minds.
On the positive side, manufacturers have cited expanding levels of activity now for 32 straight months, and the outlook remains promising. Moreover, pricing pressures—a major concern several months ago—have lessened substantially since then. The index for prices fell from 54.3 to 50.0 in this report.
- Personal Consumption Expenditures Deflator: The PCE deflator rose 0.2 percent in March, the fastest rate of increase since October, largely on higher energy costs, up 3.6 percent. At the same time, the core PCE deflator, which excludes food and energy prices, was flat in March. Over the past 12 months, the PCE deflator has risen 1.5 percent, up from 1.3 percent in February, the slowest year-over-year pace since September 2016. Core inflation inched down from 1.7 percent year-over-year in February to 1.6 percent in March, the lowest reading since January 2018.
Overall, the data continue to suggest that price growth has moderated substantially over the past nine months. This should provide some comfort to the Federal Open Market Committee, as it should allow the committee the luxury of being more “dovish” in setting monetary policy over the coming months in 2019.
- Personal Income and Spending: Personal consumption expenditures jumped 0.9 percent in March, soaring after a soft 0.1 percent gain in February. Durable and nondurable goods spending rose 2.3 percent and 1.4 percent in March, respectively. Encouragingly, personal spending has risen 4.4 percent year-over-year, continuing to inch higher since weakening to 3.8 percent year-over-year in December (which was also a decent figure). This is a sign that Americans have once again started to open their pocketbooks. The saving rate is more evidence of this, with the rate plummeting from 7.7 percent in December to 6.5 percent in March.
Personal income edged up 0.1 percent in March, easing a bit from a 0.2 percent increase in February. On a year-over-year basis, personal income has risen 3.8 percent since March 2018, off from 4.2 percent year-over-year in February.
- Productivity and Costs: Manufacturing labor productivity grew 1.7 percent in the first quarter, expanding for the fourth straight quarter. With that said, output in the sector declined 1.0 percent in the first quarter, the first decrease since the third quarter of 2017. At the same time, hours worked fell 2.6 percent in the latest quarter, with unit labor costs up 0.8 percent. Labor productivity for durable and nondurable goods firms increased 1.4 percent and 2.1 percent, respectively, in the first quarter. However, durable and nondurable goods output fell 0.9 percent and 1.0 percent, respectively.
Manufacturing labor productivity in the sector rose 0.6 percent in 2018, according to revised data. This was consistent with the average over the past three years (0.6 percent). This remained less than desired. The average growth rate for manufacturing labor productivity registered 3.9 percent and 4.7 percent in the 1990–2000 and 2002–2008 time frames, respectively, or the two prior economic recoveries.
|
|
|
Thank you for subscribing to the NAM’s Monday Economic Report.
If you’re part of an NAM member company and not yet subscribed, email us. If you’re not an NAM member, become one today!
|
|
|
|
|
|
|
|
|
|
|

