 |
| If you're having trouble reading this, click here. |
|
| MONDAY ECONOMIC REPORT |
|
|
|
|
| Essential Takes on Leading Economic Indicators |
|
By Chad Moutray, Ph.D., CBE - May 13, 2019 - SHARE


|
|
<
|
|
|
|
Pricing Pressures Moderate, Providing Flexibility for the Federal Reserve
|
|
| The Weekly Toplines |
|
- Consumer and producer prices were higher in April, largely from increased energy costs, but the bigger storyline is that inflation remains quite modest overall. The moderation of pricing pressures has provided some flexibility to the Federal Reserve, allowing it to pause on future rate hikes until incoming data suggest further actions are warranted.
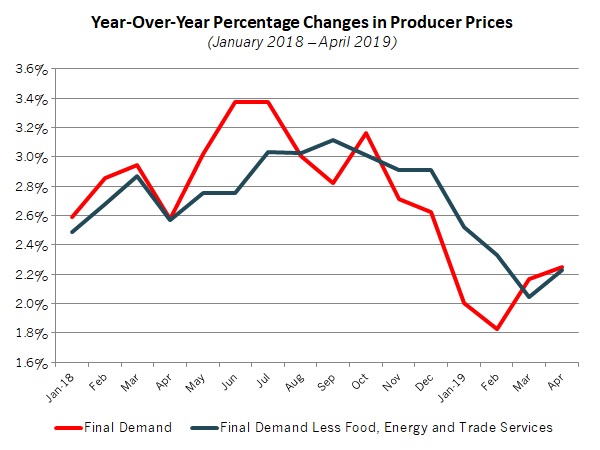
- Over the past 12 months, producer prices for final demand goods and services have risen 2.3 percent. Despite the uptick in the latest data, overall inflationary pressures continue to suggest some stabilization from last year, when rising input prices posed a major challenge for manufacturers. Indeed, raw material costs have decelerated since peaking at 3.1 percent year-over-year in September.
- The data were similar for the consumer price index, with inflation rising 2.0 percent year-over-year. That is down from 2.9 percent in July, the highest year-over-year rate since February 2012, reflecting an overall deceleration in consumer price growth since mid-2018.
- There were 476,000 manufacturing job openings in March, with durable goods job postings at an 18-year high. Over the past 12 months, job openings have averaged more than 475,000 per month--a highly elevated pace even as this rate has pulled back from the all-time highs in August and December (501,000). This echoes concerns seen elsewhere about the difficulties in finding talent in the tight labor market.
- Meanwhile, there were 7,488,000 nonfarm job openings in March, just shy of the all-time high in January (7,625,000). In addition, there continued to be more job openings in the U.S. economy than the number of people looking for work for the 13th straight month--a gap of nearly 1.3 million in the latest data.
- The U.S. trade deficit edged slightly higher in March. Goods exports had the best reading since June 2018, but that was offset by higher goods imports. Meanwhile, U.S.-manufactured goods exports were essentially unchanged in the first quarter of 2019 relative to the same time period in 2018, using non-seasonally adjusted data.
- On the topic of trade, the United States increased the supplemental tariffs on $200 billion worth of Chinese goods, from 10 percent to 25 percent, on Friday as negotiators failed to reach an agreement that might have prevented that action. While trade talks with China will continue, higher tariffs, the threat of additional Chinese retaliatory actions and additional U.S. tariffs will lead to increased uncertainty in the marketplace. Financial markets have already reflected such anxieties.
NAM President and CEO Jay Timmons noted that this should accelerate negotiations for a bilateral, enforceable trade deal. He added, "A trade war will not solve our problems. So we look forward to the United States and China returning to the negotiating table to get this deal done as soon as possible."
|
 |
|
| Economic Indicators |
|
Last Week's Indicators:
(Summaries Appear Below)
Monday, May 6
None
Tuesday, May 7
Consumer Credit
Job Openings and Labor Turnover Survey
Wednesday, May 8
None
Thursday, May 9
International Trade Report
Producer Price Index
Friday, May 10
Consumer Price Index
|
|
|
|
This Week's Indicators:
Monday, May 13
None
Tuesday, May 14
NFIB Small Business Survey
Wednesday, May 15
Industrial Production
NAHB Housing Market Index
New York Fed Manufacturing Survey
Retail Sales
Thursday, May 16
Housing Starts and Permits
Philadelphia Fed Manufacturing Survey
Friday, May 17
Conference Board Leading Indicators
State Employment Report
University of Michigan Consumer Sentiment
|
|
|
| Deeper Dive |
|
- Consumer Credit: U.S. consumer credit outstanding increased 3.1 percent in March, slowing from a gain of 4.6 percent in February. Total consumer credit registered $4.052 trillion in March, with $1.057 trillion in revolving credit and $2.995 trillion in nonrevolving credit. Revolving credit (including credit cards and other lines of credit) declined 2.5 percent in March, suggesting some hesitance among the public to incur more credit card debt. It was the first monthly decline since June 2018, but a rebound would be expected moving forward. In contrast, nonrevolving credit (including auto and student loans) rose 5.0 percent in March, the same pace as in February. Over the past 12 months, Americans have increased consumer credit outstanding by 4.9 percent, with revolving and nonrevolving credit up 3.2 percent and 5.6 percent year-over-year, respectively.
- Consumer Price Index: Consumer prices rose for the third straight month, increasing 0.3 percent in April. This was largely due to higher energy prices, which increased 2.9 percent for the month. Food prices edged down 0.1 percent in April. Excluding food and energy, consumer prices edged up 0.1 percent for the third consecutive month. Over the past 12 months, the consumer price index has risen 2.0 percent, inching up from 1.9 percent year-over-year in March. Yet, consumer prices had risen 2.9 percent in July, the highest year-over-year rate since February 2012, reflecting an overall deceleration in consumer price growth since mid-2018.
At the same time, core inflation (which excludes food and energy) rose 2.1 percent year-over-year. Other than for apparel, all other major segments have seen costs rise over the past 12 months. Still, price growth appears to be stable for now, at the Federal Reserve's stated goal of core price inflation around 2 percent.
- International Trade Report: The U.S. trade deficit edged slightly higher, up from $49.29 billion in February to $50.00 billion in March. In general, the data have been highly volatile over the past year, with wide swings from month to month. In March, goods exports rose from $139.68 billion to $141.71 billion, the best reading since June 2018, but that was offset by higher goods imports, up from $211.57 billion to $214.13 billion. The biggest mover in both cases was industrial supplies and materials (exports up $1.72 billion, imports up $2.40 billion), led by increased activity (and prices) for petroleum products. Beyond goods, the service-sector trade surplus edged down from $22.60 billion to $22.42 billion.
In non-seasonally adjusted data, U.S.-manufactured goods exports totaled $280.80 billion through the first three months of 2019, essentially unchanged from $280.56 billion in the first quarter of 2018.
- Job Openings and Labor Turnover Survey: Job openings in the manufacturing sector dipped slightly from 480,000 in February to 476,000 in March. Durable goods job postings rose to 318,000 in March, the highest level since January 2001, but the headline number was pulled lower by reduced nondurable goods job openings for the month. Over the past 12 months, job openings have averaged more than 475,000 per month--a highly elevated pace even as this rate has pulled back from the all-time highs in August and December (501,000). This echoes concerns seen elsewhere about the difficulties in finding talent in the tight labor market.
With that said, net hiring in the manufacturing sector was negative in March, with separations exceeding hiring by 11,000 workers. Speaking to the challenges that firms are having in attracting and keeping workers, the number of quits in the manufacturing sector increased from 211,000 to 221,000 for the month. That was not far from November's record high (226,000).
Meanwhile, nonfarm job openings increased from 7,142,000 in February to 7,488,000 in March, just shy of the all-time high in January (7,625,000). In addition, there continued to be more job openings in the U.S. economy than the number of people looking for work (6,211,000 in March and 5,824,000 in April) for the 13th straight month. That suggests there were nearly 1.3 million more job postings than there were unemployed people to fill them.
- Producer Price Index: Producer prices for final demand goods and services rose 0.2 percent in April, slowing from the 0.6 percent gain in March. Likewise, producer prices for final demand goods increased 0.3 percent in April after rising 1.0 percent in March. In April, energy costs increased 1.8 percent, extending the solid 5.6 percent jump in March. Food prices fell 0.2 percent. Core inflation for goods, which excludes food, energy and trade services, was unchanged for the month.
Over the past 12 months, producer prices for final demand goods and services have risen 2.3 percent, slightly accelerating from the 2.2 percent year-over-year pace in March. At the same time, core producer prices have grown 2.2 percent year-over-year, up from 2.0 percent in the previous report. Despite the uptick in the latest data, overall inflationary pressures continue to suggest some stabilization from last year, when rising input prices posed a major challenge for manufacturers. Indeed, raw material costs have decelerated since peaking at 3.1 percent year-over-year in September.
In addition, the moderation of input cost growth has provided some flexibility to the Federal Reserve, allowing it to pause on future rate hikes until incoming data suggest further actions are warranted.
|
|
| Take Action |
|
- Attend the 15th Annual Manufacturing Leadership Summit: Register now for the industry's premier Manufacturing 4.0 conference this year, the NAM's 2019 Manufacturing Leadership Summit at the Hyatt Regency in Huntington Beach, California, June 10-12. The overall theme for the event is Manufacturing 4.0: Going for Gold. Strategies to Identify and Deliver Business Value from the Digital Revolution's Next Phase. Attend industry-leading keynotes, interactive think tanks, briefings from ML Awards winners, peer-to-peer networking events and the 2019 ML Awards Gala Dinner. To register, click here.
|
|
Thank you for subscribing to the NAM's Monday Economic Report.
If you're part of an NAM member company and not yet subscribed, email us. If you're not an NAM member, become one today!
|
|
|
|
|
|
|
|
|
|
|

