 |
| If you’re having trouble reading this, click here. |
|
| MONDAY ECONOMIC REPORT |
|
|
|
|
| Essential Takes on Leading Economic Indicators |
|
By Chad Moutray, Ph.D., CBE – September 16, 2019 – SHARE


|
|
<
|
|
|
| Strong Motor Vehicle Spending Lifted Retail Sales in August |
|
| The Weekly Toplines |
|
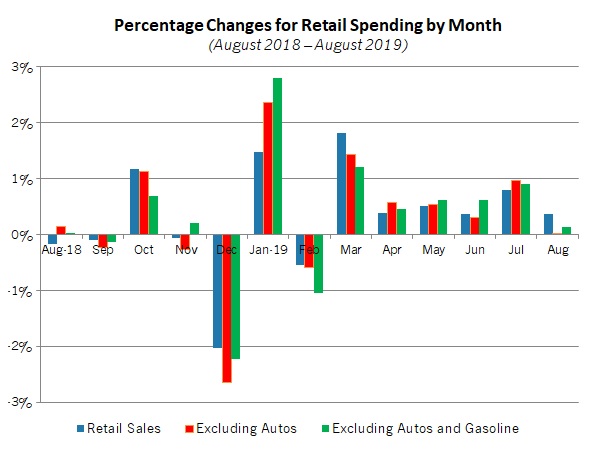
- Retail sales rose by 0.4 percent in August, increasing for the sixth straight month. Spending was buoyed by solid growth at motor vehicle and parts dealers, which jumped 1.8 percent for the month. Excluding auto sales, retail spending was unchanged in August. Over the past 12 months, retail sales have risen a solid 4.1 percent.
- Retail strength matters because consumer spending has helped to prop up economic growth, enough to offset drags from business investment and net exports. While Americans continued to spend at a healthy pace overall, growth in August was more mixed than we might prefer.
- The Index of Consumer Sentiment from the University of Michigan and Thomson Reuters stabilized in September after falling to its lowest point in nearly three years in August. Americans were somewhat more upbeat in their assessments relative to last month, when consumers were anxious about increased trade policy uncertainties and volatility in financial markets.
- Meanwhile, consumers were more willing to incur credit card debt in July, with revolving credit soaring 11.2 percent for the month, rebounding from a decline of 0.2 percent in June. Total consumer credit outstanding rose 6.8 percent in July, up from 4.0 percent in June.
- Job openings in the manufacturing sector jumped to another all-time high, rising from 515,000 in June to 522,000 in July. This was led by strength in postings from durable goods manufacturers, with openings also increasing to a new record level. These results echo ongoing concerns about the difficulties of finding talent in the tight labor market, which manufacturers continue to cite as their top challenge.
- More importantly, for the 17th straight month, the U.S. economy reported more job openings than the number of people looking for work (6,063,000 in July). That statistic suggests there were roughly 1.15 million more job postings than there were unemployed people to fill them.
- In addition, the number of quits in the economy soared to a new all-time high, rising to 3,592,000 in July. This suggests that there is a lot of churn in the labor market, with more Americans exploring their options. (Manufacturing quits had hit a record level in April, but they have fallen back since then.)
- Consumer and producer prices both edged up 0.1 percent in August. Reduced energy costs helped to keep a lid on inflationary pressures. Overall, price growth has decelerated over the course of the past year, which has been welcome news for consumers and manufacturers. Core producer price inflation rose 1.8 percent year-over-year, for instance. With that said, core consumer prices, which exclude food and energy, have increased 2.4 percent since August 2018, the highest rate since September 2008.
- The Federal Open Market Committee is expected to reduce short-term rates at its meeting on September 17–18 this week. With participants expressing more interest in stimulating economic growth, rather than concern over inflation, the FOMC will build on its rate cut last month.
|
 |
|
| Economic Indicators |
|
Last Week's Indicators:
(Summaries Appear Below)
Monday, September 9
Consumer Credit
Tuesday, September 10
Job Openings and Labor Turnover Survey
NFIB Small Business Survey
Wednesday, September 11
Producer Price Index
Thursday, September 12
Consumer Price Index
Friday, September 13
Retail Sales
University of Michigan Consumer Sentiment
|
|
|
|
This Week's Indicators:
Monday, September 16
New York Fed Manufacturing Survey
Tuesday, September 17
Industrial Production
NAHB Housing Market Index
Wednesday, September 18
FOMC Monetary Policy Statement
Housing Starts and Permits
Thursday, September 19
Conference Board Leading Indicators
Existing Home Sales
Philadelphia Fed Manufacturing Survey
Friday, September 20
State Employment Report
|
|
|
| Deeper Dive |
|
- Consumer Credit: U.S. consumer credit outstanding rose 6.8 percent in July, accelerating from the gain of 4.0 percent in June. Total consumer credit registered $4.123 trillion in July, with $1.081 trillion in revolving credit and $3.042 trillion in nonrevolving credit. Revolving credit (including credit cards and other credit lines) soared 11.2 percent in July, rebounding resoundingly from the decline of 0.2 percent seen in June. This suggests that Americans regained their willingness to incur more credit card debt for the month after some hesitance in the prior month. This should bode well for consumer spending. At the same time, nonrevolving credit (including auto and student loans) increased 5.3 percent, off slightly from the 5.6 percent rise in June.
Over the past 12 months, consumer credit outstanding has risen 5.2 percent, with revolving and nonrevolving credit up 4.6 percent and 5.4 percent year-over-year, respectively.
- Consumer Price Index: Consumer prices inched up 0.1 percent in August, slowing from the 0.3 percent gain seen in July. Reduced energy costs, which fell 1.9 percent, helped to keep a lid on inflationary pressures for consumers for the month, with food prices flat for the third straight report. Over the past 12 months, the consumer price index has risen 1.8 percent, unchanged from July’s reading. Consumer prices had risen 2.9 percent in July 2018, the highest year-over-year rate since February 2012. The current data reflect the sizable deceleration in consumer price growth since then.
At the same time, core inflation (which excludes food and energy) rose 2.4 percent year-over-year, up from 2.2 percent in the prior release and the highest rate since September 2008. Looking at the major segments in the release, the fastest categories of growth were in medical care services, shelter and used cars and trucks.
Even with an acceleration in core price growth in August, inflation appears to be stable for now and not far from the Federal Reserve’s stated goal of core price inflation around 2 percent. As such, the Federal Open Market Committee is expected to reduce short-term rates at its meeting on September 17–18. With participants expressing more interest in stimulating economic growth, rather than concern over inflation, the FOMC will build on its rate cut last month.
- Job Openings and Labor Turnover Survey: Job openings in the manufacturing sector jumped to another all-time high, rising from 515,000 in June to 522,000 in July. This was led by strength in postings from durable goods manufacturers, with openings also increasing to a new record level, up from 322,000 to 331,000 for the month. Job openings for nondurable goods firms edged down from 193,000 to 191,000. These results echo ongoing concerns about the difficulties of finding talent in the tight labor market, which manufacturers continue to cite as their top challenge.
Net hiring accelerated in July, as well. Hiring in the manufacturing sector rose from 336,000 to 345,000, and net separations fell from 331,000 to 325,000. As a result, net hiring was 20,000 in July, its strongest monthly reading since January.
Meanwhile, nonfarm job openings changed little for the month, down from 7,248,000 in June to 7,217,000 in July. More importantly, for the 17th straight month, the U.S. economy reported more job openings than the number of people looking for work (6,063,000 in July). That statistic suggests there were roughly 1.15 million more job postings than there were unemployed people to fill them. In addition, the number of quits in the economy soared to a new all-time high, rising to 3,592,000 in July. This suggests that there is a lot of churn in the labor market, with more Americans exploring their options. (Manufacturing quits had hit a record level in April, but they have fallen back since then.)
- NFIB Small Business Survey: The National Federation of Independent Business reported that the Small Business Optimism Index fell from 104.7 in July to 103.1 in August, continuing to seesaw in recent months. Despite softening from the all-time high in August 2018 (108.8), small businesses remain upbeat overall. Twenty-six percent of respondents in August said the next three months would be a “good time to expand,” unchanged from July. Nonetheless, the reduced headline index stemmed lower sales expectations, down from a net percentage of 22 percent to 17 percent. Capital spending plans remained strong, as 28 percent of firms said they planned to make a capital expenditure in the next three to six months, the same pace as in July. For August, 59 percent of respondents said they made a capital expenditure in the past six months, up from 57 percent in July.
The labor market data remain solid despite pulling back somewhat. For instance, the percentage of small business owners saying they had job openings dipped from 39 percent in July, which matched its all-time high, to 35 percent in August. The net percentage planning to hire in the next three months edged down from 21 percent to 20 percent. In addition, respondents cited the quality of labor as the top “single most important problem” for the 17th straight month.
- Producer Price Index: Producer prices for final demand goods and services edged up 0.1 percent in August, slowing slightly from the 0.2 percent gain seen in July. At the same time, producer prices for final demand goods fell 0.5 percent, declining for the third time in the past four months, with food and energy costs down 0.6 percent and 2.5 percent, respectively. Core inflation for goods, which excludes food and energy, was unchanged. Meanwhile, producer prices for final demand services increased by 0.3 percent for the month.
Over the past 12 months, producer prices for final demand goods and services have risen 1.8 percent, up from 1.7 percent year-over-year growth in the previous release, but down dramatically from 3.0 percent in August 2018. In addition, core producer prices have grown 1.9 percent year-over-year, accelerating slightly from 1.7 percent in July, which had been the lowest since January 2017.
Overall, these data continue to suggest that inflationary pressures remain under control, at least for now, with core prices rising below the Federal Reserve’s stated goal of 2 percent. In addition, input costs have largely decelerated over the course of the past year. This has been welcome news for manufacturers, many of whom cited challenges with rising input costs last summer as one of their top challenges. In addition, the easing in producer price growth has provided some comfort to the Federal Reserve, particularly as it explores an additional rate cut at its next meeting on September 17–18.
- Retail Sales: Consumer spending rose by 0.4 percent in August, extending the 0.8 percent gain seen in July and increasing for the sixth straight month. Spending was buoyed by solid growth at motor vehicle and parts dealers, which jumped 1.8 percent for the month. Excluding auto sales, retail spending was unchanged in August. At the same time, gasoline station sales were down 0.9 percent in August, pulled lower by reduced prices. With motor vehicles and gasoline station sales excluded, retail spending edged up 0.1 percent.
Over the past 12 months, retail sales have risen a solid 4.1 percent, up from 3.6 percent year-over-year in the prior release. In addition, spending grew by 4.2 percent year-over-year with motor vehicles and gasoline station sales excluded.
As such, these data were more mixed than we might prefer. While Americans continued to spend at a healthy pace, growth could have been more broad-based in August. The largest increases in retail sales for the month, outside of automobiles, was for building material and garden supply stores, health and personal care stores, nonstore retailers and sporting goods and hobby stores. In addition to gasoline stations, there was reduced spending at clothing and accessory stores, department stores, food services and drinking places, furniture and home furnishings stores and grocery stores.
The structural shift toward online spending can be seen clearly once again, with sales for nonstore retailers jumping 16.0 percent since August 2018 to a new all-time high ($67.6 billion). However, department store sales were down 5.4 percent year-over-year.
- University of Michigan Consumer Sentiment: The Index of Consumer Sentiment stabilized in September after falling to its lowest point in nearly three years in August. The headline measure rose from 89.8 in August to 92.0 in September, according to preliminary estimates from the University of Michigan and Thomson Reuters. Americans were somewhat more upbeat in their assessments of current and future conditions in this survey relative to last month, when consumers were anxious about increased trade policy uncertainties and volatility in financial markets. Final data will be released on September 27.
|
|
| Take Action |
|
If you have not already done so, please take a moment to complete a new survey from The Manufacturing Institute on workforce training efforts at your company. This 17-question survey will help us measure training and upskilling activities in the manufacturing sector, especially as firms work to ensure their workers have the skills needed to be successful at their jobs. It will be conducted annually, starting with this survey.
Last year, NAM President and CEO Jay Timmons and Manufacturing Institute Executive Director Carolyn Lee asked manufacturers to commit to President Donald Trump’s Pledge to America’s Workers—a commitment to expand programs that educate, train and reskill American workers from high-school age to near retirement. In July, they announced that manufacturers had committed to training roughly 1.2 million workers over the next five years—a bold goal, but one that we feel accurately reflects the changing nature and needs of the sector.
To complete the survey, click here. Responses are due by Tuesday, Sept. 17, at 5:00 p.m. EDT. As always, all responses are anonymous.
|
|
Thank you for subscribing to the NAM’s Monday Economic Report.
If you’re part of an NAM member company and not yet subscribed, email us. If you’re not an NAM member, become one today!
|
|
|
|
|
|
|
|
|
|
|

