 |
| If you’re having trouble reading this, click here. |
|
| MONDAY ECONOMIC REPORT |
|
|
|
|
| Essential Takes on Leading Economic Indicators |
|
By Chad Moutray, Ph.D., CBE – September 23, 2019 – SHARE


|
|
<
|
|
|
| Reduced Mortgage Rates Helped to Reenergize the Housing Market |
|
| The Weekly Toplines |
|
- New residential construction jumped 12.3 percent, rising from an annualized 1,215,000 units in July to 1,364,000 units in August. That was the strongest month for housing starts since June 2007 and suggests that reduced mortgage rates have had a notable impact. The average rate for a 30-year fixed-rate mortgage was 3.73 percent last week, up from 3.56 percent the prior week, but still notably lower than at the end of last year, according to Freddie Mac.
- Over the past 12 months, housing starts have risen 6.6 percent, the highest year-over-year figure since August 2018. Meanwhile, housing permits soared 7.7 percent in the latest report, up from 1,317,000 units at the annual rate in July to 1,419,000 units in August. That was the best reading since May 2007 and suggests that construction should accelerate in the coming months, echoing the homebuilder optimism for solid demand growth.
- Existing home sales rose 1.3 percent, up from an annualized 5.42 million units in July to 5.49 million units in August, the best reading since March 2018.
- Manufacturing production rebounded in August, up 0.5 percent. It was the third increase in the past four months, providing some encouragement that the sector might be stabilizing despite a challenging year so far. Nonetheless, manufacturers have struggled due to weaker global growth and trade uncertainties over much of the past 12 months, with a decline of 0.4 percent since August 2018, the third negative reading so far in 2019.
- For 2019 as a whole, the current forecast is for no growth in manufacturing production, down from an increase of 2.7 percent in 2018.
- Manufacturers in the New York and Philadelphia Federal Reserve Bank districts both reported expansions in activity in September, with positive expectations for the next six months. In each of these surveys, respondents were experiencing the fastest paces of input cost growth so far this year.
- As expected, the Federal Open Market Committee voted to reduce the federal funds rate by 25 basis points to a range of 1.75 to 2 percent. In doing so, the Federal Reserve hopes to extend the economic expansion, even as it recognizes weaker data on business investment and exports.
- There was notable disagreement about the direction of monetary policy. In new economic projections, participants appeared to signal no additional rate cuts for 2019 or 2020. Yet, several individuals felt there could be one more cut in short-term rates this year, and Federal Reserve Chair Jerome Powell noted that incoming data will determine actions moving forward.
Given improved housing and production data out last week, I anticipate 2.3 percent growth in real GDP in the third quarter, with a similar rate for 2019 as a whole.
|
 |
|
| Economic Indicators |
|
Last Week's Indicators:
(Summaries Appear Below)
Monday, September 16
New York Fed Manufacturing Survey
Tuesday, September 17
Industrial Production
NAHB Housing Market Index
Wednesday, September 18
FOMC Monetary Policy Statement
Housing Starts and Permits
Thursday, September 19
Conference Board Leading Indicators
Existing Home Sales
Philadelphia Fed Manufacturing Survey
Friday, September 20
State Employment Report
|
|
|
|
This Week's Indicators:
Monday, September 23
Chicago Fed National Activity Index
IHS Markit Flash U.S. Manufacturing PMI
Tuesday, September 24
Conference Board Consumer Confidence
Richmond Fed Manufacturing Survey
Wednesday, September 25
New Home Sales
Thursday, September 26
Gross Domestic Product (Second Revision)
International Trade in Goods (Preliminary)
Kansas City Fed Manufacturing Survey
Friday, September 27
Durable Goods Orders and Shipments
Personal Consumption Expenditures Deflator
Personal Income and Spending
University of Michigan Consumer Sentiment (Revision)
|
|
|
| Deeper Dive |
|
- Conference Board Leading Indicators: The Leading Economic Index was flat in August, pulling back from a strong 0.4 percent gain in July. New orders for manufactured goods continued to be a drag on the LEI, with the interest rate spread, stock prices and unemployment claims negatively impacting activity in August. In contrast, there were several bright spots to offset those negative impacts, including from the average workweek for production workers, building permits, consumer confidence and overall lending conditions.
Meanwhile, the Coincident Economic Index rebounded, up 0.3 percent in August after being flat in July. All the subcomponents contributed positively to growth in the CEI in August, including industrial production, which rose 0.6 percent for the month (see below). Manufacturing and trade sales, nonfarm payrolls and personal income were also favorable in the August data.
- Existing Home Sales: The National Association of Realtors reported that existing home sales rose 1.3 percent, up from an annualized 5.42 million units in July to 5.49 million units in August. That reading, which was the best since March 2018, reflected strength in every region except the West, with growth for both single-family and condominium and co-op units for the month. This news suggests that reduced mortgage rates have produced some traction in the market despite lingering challenges with affordability and the lack of sufficient workers. Along those lines, existing home sales have risen a modest 2.6 percent over the past 12 months, up from 5.35 million units in August 2018.
NAR Chief Economist Lawrence Yun noted that inventories remain low, and in August, there were 4.1 months of supply on the market, down from 4.4 months and 4.2 months in June and July, respectively. This decline has led to higher prices. The median sales price for existing homes has increased 4.7 percent year-over-year, up to $278,200 in August.
- FOMC Monetary Policy Statement: As expected, the Federal Open Market Committee voted to reduce the federal funds rate by 25 basis points to a range of 1.75 to 2 percent. In doing so, the Federal Reserve hopes to extend the economic expansion, even as it recognizes weaker data on business investment and exports. At the same time, consumer spending and the labor market remain bright spots, providing a mixed picture for participants to absorb and debate. Core inflation remains below the Federal Reserve’s stated target of 2 percent.
There was notable disagreement on the FOMC about the direction of monetary policy. Esther George (Kansas City) and Eric Rosengren (Boston) dissented, preferring to keep short-term rates unchanged. In contrast, James Bullard (St. Louis), who would have voted to cut rates by 50 basis points, also dissented. Looking at those two options, the FOMC opted for a “middle ground” approach of a 25-basis-point cut, which was also the expectation in the financial markets.
In addition, the Federal Reserve released updated economic projections, which appear to signal no additional rate cuts for 2019 or 2020. While that might be the median outlook for the federal funds midpoint, there are seven participants who forecast one more cut in short-term rates this year, down to a range of 1.5 to 1.75 percent. Outside of monetary policy, the other economic forecasts changed little from the June report. Participants see the U.S. economy growing 2.2 percent and 2.0 percent in 2019 and 2020, respectively, with the unemployment rate hovering at 3.7 percent in both years.
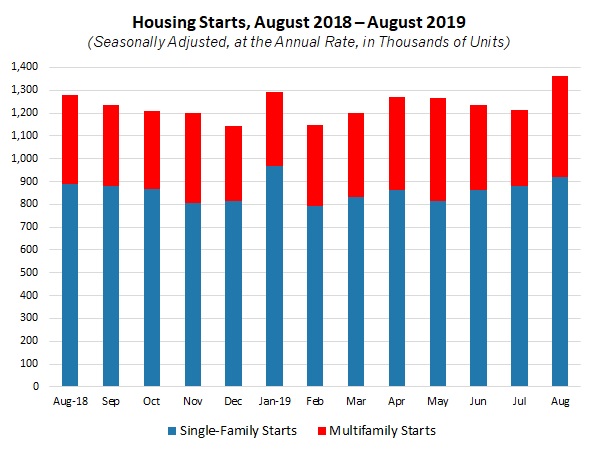
- Housing Starts and Permits: New residential construction jumped 12.3 percent, rising from an annualized 1,215,000 units in July to 1,364,000 units in August. That was the strongest month for housing starts since June 2007 and suggests that reduced mortgage rates have had a notable impact. Single-family (up from 880,000 units to 919,000 units) and multifamily (up from 335,000 units to 445,000 units) housing starts both increased in August. Over the past 12 months, new residential construction has risen 6.6 percent, the highest year-over-year figure since August 2018.
Meanwhile, housing permits soared 7.7 percent in the latest report, up from 1,317,000 units at the annual rate in July to 1,419,000 units in August. That was the best reading since May 2007, with strength in both the single-family (up from 829,000 units to 866,000 units) and multifamily (up from 488,000 units to 553,000 units) segments. This suggests that construction should accelerate in the coming months, echoing the homebuilder optimism for solid demand growth (see below). Would-be homebuyers appear to be motivated by mortgage rates that are near three-year lows.
- Industrial Production: Manufacturing production rebounded in August, up 0.5 percent after declining 0.4 percent in July. It was the third increase in the past four months, providing some encouragement that the sector might be stabilizing despite a challenging year so far. On that note, manufacturers have struggled due to weaker global growth and trade uncertainties over much of the past 12 months. Manufacturing production has declined 0.4 percent since August 2018, the third negative reading so far in 2019. For 2019 as a whole, the current forecast is for no growth in manufacturing production, down from an increase of 2.7 percent in 2018.
At the same time, manufacturing capacity utilization rose from 75.4 percent in July to 75.7 percent in August. While that represented an improvement, capacity in the sector remained lower than the 77.3 percent figure in December, which was the best since March 2008.
In August, durable and nondurable goods production both increased 0.5 percent, matching the headline number. Thirteen of the 19 major manufacturing sectors experienced better output for the month. The largest production gains occurred in chemicals, machinery, nonmetallic mineral products, plastics and rubber products and primary metals. In contrast, output decreased in August for apparel and leather, electrical equipment, appliances and components, food, beverage and tobacco products, motor vehicles and parts, paper and petroleum and coal products.
Meanwhile, total industrial production also bounced back, rising 0.6 percent in August after edging down 0.1 percent in July. In addition to growth in manufacturing output, production also increased for mining (up 1.4 percent) and utilities (up 0.6 percent). Nonetheless, industrial production has risen just 0.4 percent over the past 12 months, the slowest year-over-year pace since February 2017. Total capacity utilization improved from 77.5 percent, the weakest rate since October 2017, to 77.9 percent. Yet, one year ago, overall capacity utilization stood at 79.3 percent, representing a large pullback since then.
- NAHB Housing Market Index: The National Association of Home Builders and Wells Fargo reported that confidence rose to an 11-month high in September. The Housing Market Index increased from 67 in August to 68 in September, with builders optimistic that reduced mortgage rates will lead to stronger demand. Indeed, the index for single-family sales rose from 73 to 75, the strongest reading since May 2018. With that said, the NAHB cites ongoing challenges, especially with the shortage of skilled labor, a “lack of buildable lots” and rising costs that hurt affordability for would-be homebuyers. In addition, NAHB Chief Economist Robert Dietz said that builders worry about slowing economic growth, particularly in communities with a heavy manufacturing presence, which could impact housing activity negatively in those markets.
- New York Fed Manufacturing Survey: Manufacturing activity in the New York Federal Reserve Bank’s district expanded for the third straight month, but with marginal growth in September. The headline index declined from 4.8 in August to 2.0 in September, with slowing expansions for new orders and shipments. At the same time, hiring and the average employee workweek both rebounded from declines in the prior survey, and inventories strengthened. Pricing pressures also picked up somewhat, with 34.6 percent of respondents citing higher input costs for the month, the fastest pace year to date.
Meanwhile, respondents to the Empire State Manufacturing Survey remain positive in their outlook for the next six months, albeit with continued easing in many measures. More than 40 percent of respondents continue to anticipate higher sales and shipments over the coming months, and 25.9 percent and 24.2 percent predict more hiring and capital expenditures, respectively. It was the weakest rate of expected capital expenditures growth, including for technology spending, since August 2016.
- Philadelphia Fed Manufacturing Survey: Manufacturing activity continued to expand at a decent pace in September, albeit at a somewhat slower rate. The composite index of general business activity pulled back from 16.8 in August to 12.0 in September, but with an improvement in shipments, employment and the average employee workweek. At the same time, the pace of growth for new orders softened slightly, but still with a solid expansion in September. Notably, the index for the prices paid for raw materials jumped from 12.8 to 33.0, the highest level since December, suggesting that input costs have accelerated at the fastest pace year to date. Nearly 53 percent of manufacturers in the region anticipate higher prices over the next six months as well.
Meanwhile, manufacturers in the district remain positive in their outlook for the next six months, albeit with some easing from the previous release. The forward-looking composite index decreased from 32.6 in August to 20.8 in September. More than 47 percent of respondents expect new orders to rise in the coming months, with 54.5 percent predicting increased shipments, 35.4 percent forecasting more hiring and 30.8 percent anticipating more capital spending.
In a special question, 69.0 percent of respondents said their spending on capital expenditures included the modernization of their manufacturing processes. Other top responses included the expansion of manufacturing facilities (29.3 percent), the launch of new units (24.1 percent) and “internationalization” (17.4 percent). Of those companies that said capital spending was “less important,” softer economic conditions and policy uncertainties, including trade, were cited.
- State Employment Report: Arkansas created the most net new manufacturing jobs in August, adding 1,800 workers, with California (up 1,700), Kansas (up 1,100) and Illinois (up 1,000) close behind. In addition, Texas saw the greatest job gains in the sector over the past 12 months, with manufacturing employment in the state up 26,700 since August 2018. Other states with the fastest manufacturing job growth year-over-year included California (up 13,700), Washington (up 11,800), Florida (up 11,100) and Arizona (up 9,300). Meanwhile, Vermont had the lowest unemployment rate in the nation in August, remaining at 2.1 percent.
|
|
|
Thank you for subscribing to the NAM’s Monday Economic Report.
If you’re part of an NAM member company and not yet subscribed, email us. If you’re not an NAM member, become one today!
|
|
|
|
|
|
|
|
|
|
|

