 |
| If you’re having trouble reading this, click here. |
|
s
| MONDAY ECONOMIC REPORT |
|
|
|
|
| Essential Takes on Leading Economic Indicators |
|
By Chad Moutray, Ph.D., CBE – May 18, 2020 – SHARE


|
|
<
|
|
|
| Manufacturing Production Fell a Record-Setting 13.7% in April |
|
| The Weekly Toplines |
|
With each week, the full extent of the economic damage from COVID-19 and the abrupt decline in activity can be seen in greater detail. The severe drops in data are unprecedented. Here are the highlights of last week’s reports:
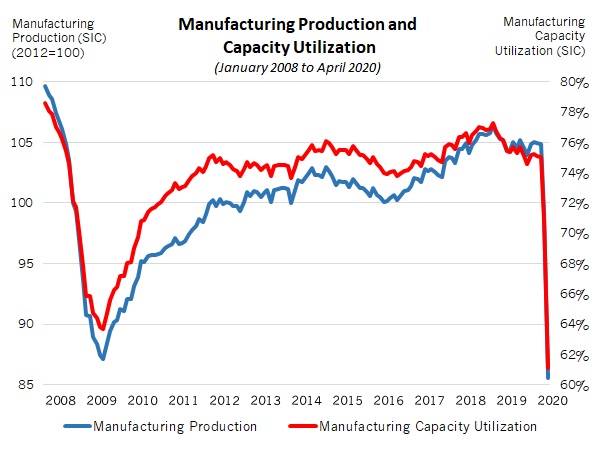
- Manufacturing production fell sharply by a record-setting 13.7% in April to the lowest level since July 28, with durable and nondurable goods output plummeting 19.3% and 8.2%, respectively. All 19 major manufacturing sectors experienced declines in April. Capacity utilization in the sector fell to 61.1%, a new all-time low.
- In the first regional sentiment survey of May, the New York Federal Reserve Banks’s monthly report continued to reflect steep declines in new orders and shipments, but employment stabilized somewhat (though it remained negative). Respondents were cautiously positive that activity would rebound over the next six months.
- Retail spending fell 16.4% in April, the largest monthly decline since the series began in 1992 and extending the 8.3% decrease seen in March. On a year-over-year basis, retail spending was down 21.6%, with a decline of 16% if automobiles and gasoline are excluded. Nonstore retailers were the only bright spot, with sales up 8.4% in April and 21.6% year-over-year as Americans purchased more online.
- After falling to the lowest level since December 2011, the Index of Consumer Sentiment edged up from 71.8 in April to 73.7 in May, according to preliminary data from the University of Michigan and Thomson Reuters. Financial conditions of respondents were the lowest in six years despite the continued issuance of CARES Act relief checks.
- There were 2,981,000 initial unemployment claims for the week ending May 9, with 36,471,000 filers over the past seven weeks. (Connecticut over-reported its claims for the week, which will lead to a revision in next week’s release.) At the same time, there were 22,833,000 Americans, or 15.7% of the workforce, receiving unemployment insurance the week of May 2,.
- There were 320,000 manufacturing job openings in March, the slowest pace since November 2016 and down from 422,000 in February. Net hiring was -433,000 in March. Quits in the manufacturing sector slowed to their lowest since June 2016, but layoffs rose from 113,000 to 566,000.
- After experiencing more job openings than the number of people looking for work for 24 straight months, the abrupt stoppage of economic activity amid the COVID-19 outbreak sharply reversed that trend, starting in March.
- The National Federation of Independent Business said that the Small Business Optimism Index fell to its lowest level since March 2013, declining from 96.4 in March to 90.9 in April. The measure for real sales expectations fell to the lowest level in the 46-year history of the survey, and the top “single most important problem” was poor sales, supplanting hiring difficulties, which had been the primary concern for two straight years.
- Consumer and producer prices fell 0.8% and 1.3%, respectively, in April, both the largest monthly declines since the Great Recession, prompting worries about deflation in the economy. More importantly, producer prices for final demand goods plunged 3.3% in April, pulled lower by a whopping 19% decrease in energy costs on oil price shocks. Year-over-year rates of growth for consumer and producer prices were the lowest since late 2015.
|
 |
|
| Economic Indicators |
|
Last Week's Indicators:
(Summaries Appear Below)
Monday, May 11
None
Tuesday, May 12
Consumer Price Index
NFIB Small Business Survey
Wednesday, May 13
Producer Price Index
Thursday, May 14
Weekly Initial Unemployment Claims
Friday, May 15
Industrial Production
Job Openings and Labor Turnover Survey
New York Fed Manufacturing Survey
Retail Sales
University of Michigan Consumer Sentiment
|
|
|
|
This Week's Indicators:
Monday, May 18
NAHB Housing Market Index
Tuesday, May 19
Housing Starts and Permits
Wednesday, May 20
None
Thursday, May 21
Conference Board Leading Indicators
Existing Home Sales
IHS Markit Flash U.S. Manufacturing PMI
Philadelphia Fed Manufacturing Survey
Weekly Initial Unemployment Claims
Friday, May 22
State Employment Report
|
|
|
| Deeper Dive |
|
- Consumer Price Index: Consumer prices fell 0.8% in April, the largest monthly decline since December 2008 and extending the 0.4% decline seen in March. Sharply lower energy prices led the headline measure decrease, with gasoline costs plummeting 20.6% for the month. In contrast, food prices rose 1.5% in April, with food-at-home costs jumping 2.6%. Over the past 12 months, the consumer prices index has risen 0.4% (seasonally adjusted), the slowest year-over-year pace since November 2015. At the same time, core inflation (which excludes food and energy) decreased 0.4% in April, the largest monthly decline in the history of the data series, which dates to 1947. On a year-over-year basis, core consumer inflation has increased 1.4% since April 2019, the slowest rate since April 2011.
The data reflect the deflationary effects of the COVID-19 outbreak, with higher costs for grocery and medical care items but declines in every other category except for shelter (which was flat). The outlook is for consumer prices to rise by 0.7% in 2020, the slowest pace of growth in five years, with core inflation up 1.9% this year.
- Industrial Production: Manufacturing production fell sharply by a record-setting 13.7% in April as firms grappled with the COVID-19 outbreak, including closures, reduced activity and significant global supply and demand disruptions. Output in the sector fell to its lowest level since July 1998. Durable and nondurable goods production plummeted 19.3% and 8.2%, respectively, with all 19 major sectors experiencing declines. The largest production decreases for the month were jaw-dropping in scale, including motor vehicles and parts (down 71.1%), apparel and leather (down 24.1%), aerospace and other transportation equipment (down 21.6%), printing and support (down 21.2%), textile and product mills (down 20.7%), furniture and related products (down 20.6%), primary metals (down 20.4%) and petroleum and coal products (down 18.5%), among others.
On a year-over-year basis, manufacturing production has declined 18%, with durable and nondurable goods output down 25.5% and 10%, respectively. Manufacturing capacity utilization has plummeted from 75.0% in February to 70.8% in March to 61.1% in April, an all-time low for a series that dates to 1948.
Meanwhile, total industrial production decreased 11.2% in April, also the largest monthly decline on record, with mining and utilities production off 6.1% and 0.9%, respectively. Over the past 12 months, industrial production dropped 15%. Total capacity utilization has declined from 76.7% in February to 73.2% in March to 64.9% in April, a record low.
- Job Openings and Labor Turnover Survey: There were 320,000 manufacturing job openings in March, the slowest pace since November 2016 and down from 422,000 in February. Over the past 12 months, job postings have averaged nearly 430,000 per month. With that said, given the COVID-19 outbreak and the sharp decline in economic activity, job openings will likely continue to decelerate in the April figures. The sector hired 299,000 workers in March, down from 334,000 in February, but separations rose from 318,000 to 732,000, the largest monthly increase on record. As a result, net hiring was -433,000 in March.
In the larger economy, nonfarm business job openings pulled back from 7,004,000 in February to 6,191,000 in March. After experiencing more job openings than the number of people looking for work for 24 straight months, the abrupt stoppage of economic activity amid the COVID-19 outbreak sharply reversed that trend, starting in March. There were 7,140,000 unemployed Americans in March—a figure that rose to 23,078,000 in April, according to the latest jobs data.
Digging further into the separations data, fewer workers were quitting their jobs, both for nonfarm businesses (down from 3,436,000 to 2,782,000, lowest since July 2015) and for manufacturing (down from 183,000 to 142,000, a pace not seen since June 2016). At the same time, layoffs increased sharply. Nonfarm business layoffs jumped from 1,846,000 in February to 11,372,000 in March. Initial unemployment claims (see below) would indicate even greater losses in April and May. Similarly, layoffs in the manufacturing sector rose from 113,000 to 566,000.
- New York Fed Manufacturing Survey: Manufacturing activity in the New York Federal Reserve Bank’s district remained very weak despite the rise in the composite index of business conditions from -78.2 in April to -48.5 in May. Respondents continued to be challenged by disruptions in their operations due to COVID-19, with 60.2% of manufacturers in the region reporting weaker orders in May. There were also sharp contractions in shipments and the average workweek. Employment stabilized somewhat but remained negative. In May, 20.8% of manufacturing leaders said that hiring was declining, improving from 58.6% who said the same thing in April.
Despite the historic declines seen the past two months, manufacturers in the Empire State Manufacturing Survey felt cautiously positive that activity would rebound over the next six months. The forward-looking composite index rose from 7.0 to 29.1 in this release, its best reading in 10 months. More than 56%, for instance, expected new orders and shipments to rise moving forward, with 28.4% anticipating more employment. Capital spending was the exception, with 29.7% predicting declines in capital expenditures over the coming months.
- NFIB Small Business Survey: The National Federation of Independent Business said that the Small Business Optimism Index fell to its lowest level since March 2013, declining from 96.4 in March to 90.9 in April. The report states, “The business impact from COVID-19, government stay-at-home orders, and mandated nonessential business closures has had a devastating impact on the small business economy.” Indeed, the measure for real sales expectations fell to the lowest level in the 46-year history of the survey, and the percentage of respondents saying that the next three months were a “good time to expand” fell from 28% in January to just 3% in April. The top “single most important problem” was poor sales, supplanting hiring difficulties, which had been the primary concern for two straight years.
The underlying data reflected the downward shift in sentiment and increased uncertainty. For instance, the rate of owners planning to hire in the next three months decreased from 21% in February to 9% in March to only 1% in April, the slowest pace since December 2012. On the capital spending front, 53% of small firms have made an investment over the past three months, down from 60% in the previous survey and also the lowest since December 2012.
- Producer Price Index: Producer prices for final demand goods and services fell for the third straight month, declining 1.3% in April, the largest monthly decline since the series began in December 2009. More importantly, producer prices for final demand goods plunged 3.3% in April, pulled lower by a whopping 19% decrease in energy costs on oil price shocks. Food prices were off 0.5% for the month. Core inflation for goods, which excludes food and energy, decreased 0.4% in April, and producer prices for final demand services were off 0.2% for the month.
Over the past 12 months, producer prices for final demand goods and services decreased from 0.7% in March to -1% in April (seasonally adjusted), the lowest year-over-year rate since December 2015. Likewise, core producer prices have fallen by a seasonally adjusted 0.2% year-over-year, slowing from 1.1% growth in March.
The Federal Reserve remains concerned about deflationary pressures from the sharp drop in economic activity due to COVID-19, and as such, it has pursued extraordinary monetary policy measures to help prop up the economy—providing a financial “bridge” for consumers and businesses until activity picks back up. These data support that notion, with prices pulling back sharply in April in light of a severe global recession.
- Retail Sales: With Americans under stay-at-home orders nationwide, consumer spending plummeted 16.4% in April, the largest monthly decline since the series began in 1992 and extending the 8.3% decrease seen in March. The extent of the decline in retail spending in April was extraordinary, with the largest declines in clothing and accessory stores (down 78.8%), electronics and appliances stores (down 60.6%), furniture and home furnishing stores (down 58.7%), sporting goods and hobby stores (down 38%), food services and drinking places (down 29.5%), department stores (down 28.9%) and gasoline stations (down 28.8%), among others. Motor vehicle and parts dealers said that sales were off 12.4%.
Excluding motor vehicles and gasoline, retail sales were down 16.2% for the month. On a year-over-year basis, retail spending was down 21.6%, with a decline of 16% if automobiles and gasoline are excluded.
Nonstore retailers were the only bright spot, with sales up 8.4% as Americans rpurchased more online. This exacerbated the consumer dynamics seen in recent years, with retail shifting from brick-and-mortar stores to online retailers. Along those lines, sales for nonstore retailers jumped 21.6% year-over-year, but department store sales fell sharply, down 47% over the past 12 months. To be fair, this decline was also exaggerated by the shutdowns, making it imperative to watch what happens in the coming months as stores start reopening.
- University of Michigan Consumer Sentiment: After falling to the lowest level since December 2011, the Index of Consumer Sentiment edged up from 71.8 in April to 73.7 in May, according to preliminary data from the University of Michigan and Thomson Reuters. The underlying data were mixed. Americans were somewhat more upbeat in their view of the current economic environment, with that measure rising from 74.3 to 83.0. However, there was continued deterioration in the outlook for future economic conditions, down from 70.1 to 67.7. The release notes that financial conditions of respondents were the lowest in six years despite the continued issuance of CARES Act relief checks. Final data will be released on May 29.
- Weekly Initial Unemployment Claims: There were 2,981,000 initial unemployment claims for the week ending May 9, down from the 3,176,000 claims added for the week ending May 2. Since peaking at 6,867,000 for the week ending March 28, initial claims have decelerated, which is encouraging, but these continue to be heartbreaking and unprecedented levels. Over the past seven weeks, 36,471,000 Americans filed for unemployment insurance, illustrating dire conditions in the labor market as the COVID-19 crisis has taken hold. California, Florida, Georgia, New York, Texas and Washington each had at least 100,000 initial unemployment claims in the latest week, with 14 states having new claims that exceeded 50,000. (Connecticut later reported that it had over-reported its initial unemployment claims, which were 29,868 instead of 298,680 as stated in this release.)
Meanwhile, continuing claims increased from 22,377,000 for the week ending April 25 to 22,833,000 for the week ending May 2 in this report, a new all-time high. The latest figure suggests that 15.7% of the workforce received unemployment insurance that week, a rate that will continue to increase substantially given the initial claims data.
The unemployment rate could peak around 20% to 22% this month before starting to fall. The forecast is for the unemployment rate to be 9% to 10% by year’s end—a shocking turn of events in the labor market following February’s 50-year low, which registered 3.5%.
|
|
Thank you for subscribing to the NAM’s Monday Economic Report.
If you’re part of an NAM member company and not yet subscribed, email us. If you’re not an NAM member, become one today!
|
|
|
|
|
|
|
|
|
| Interested in becoming a presenter of the Monday Economic Report? Email us. |
|
| Questions or comments? Email NAM Chief Economist Chad Moutray at [email protected]. |
|
| You received this email because you signed up for the NAM’s Monday Economic Report as a part of your NAM membership. |
|
| Manage my email newsletters and alerts | Unsubscribe |
|
 |
|
| © 2020 National Association of Manufacturers |
|
|
|
|
|
|
|
