 |
| If you’re having trouble reading this, click here. |
|
s
| MONDAY ECONOMIC REPORT |
|
|
|
|
| Essential Takes on Leading Economic Indicators |
|
By Chad Moutray, Ph.D., CBE – June 29, 2020 – SHARE


|
|
<
|
|
|
| As COVID-19 Worries Linger, Economy Tries to Charge Forward |
|
| The Weekly Toplines |
|
- As the nation continues to grapple with lingering COVID-19 worries, the data last week reflected bounce backs in activity, suggesting that the economy is trying to charge forward. These “green shoots” provide some encouragement that the U.S. economy will rebound in the second half of this year, even as it is also clear that activity remains well below pre-recessionary levels.
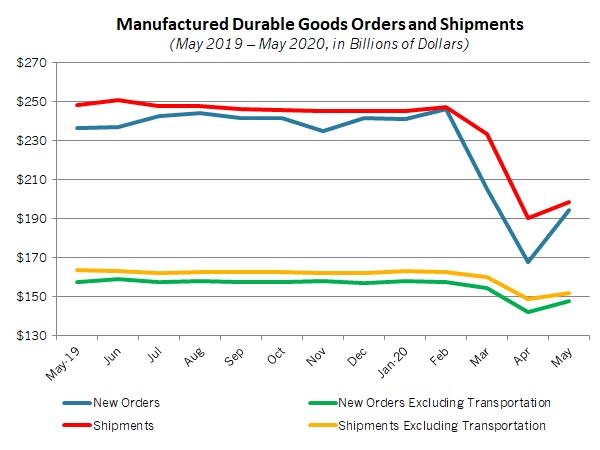
- New orders for durable goods jumped 15.8% in May, beginning the process of rebounding after plummeting 16.7% and 18.1% in March and April, respectively. Excluding transportation equipment, new orders rose 4% in May, with higher sales in every major category. Yet, new durable goods orders have dropped 17.9% over the past 12 months, or with transportation equipment excluded, sales have fallen 6.3% since May 2019.
- The IHS Markit Flash U.S. Manufacturing PMI stabilized for the second consecutive month in June, increasing from 36.1 in April, to 39.8 in May, to 49.6 in June. The index for future output improved to the best reading since February, an encouraging sign that respondents are optimistic in their outlook for the next six months.
- The regional data are also supportive of some steadying of the manufacturing sector, with activity stabilizing in both the Kansas City and Richmond Federal Reserve Bank districts in June. The same was true in the Eurozone and in the United Kingdom, according to preliminary sentiment data from IHS Markit. Yet, Germany continued to contract, albeit at a slower pace.
- In advance statistics, the goods trade deficit rose from $70.73 billion in April to $74.34 billion in May. The decline in goods exports was steeper than for goods imports. Goods exports were at the slowest pace since August 2009, and goods imports dropped to the lowest level since July 2010.
- After plummeting by a record 12.6% in April, personal consumption expenditures jumped 8.2% in May, with Americans starting to emerge from their homes and increasing their purchasing. The savings rate, which had soared to an all-time high of 32.2% in April, declined to a still elevated 22.3% in May. This suggests that consumers remain cautious in their spending as the nation continues to grapple with the COVID-19 outbreak and a severe economic recession.
- Meanwhile, personal income decreased 4.2% in May, pulling back after skyrocketing by 10.8% in April. Government assistance checks continue to boost income for many Americans, and personal income has risen 7% since May 2019.
- Manufacturing wages and salaries rose from $796.5 billion in April to $830.1 billion in May, down by 8.7% from $909.5 billion one year earlier. With more activity starting to come back online, we expect these data to continue to improve in the coming months.
- Consumer confidence rose for the second straight month, according to the University of Michigan and Thomson Reuters, but sentiment remains well below the levels seen before the COVID-19 outbreak. Respondents to the latest survey continue to express a record high level of uncertainty regarding income.
- The housing market data were mixed last week. On the one hand, new single-family home sales soared 16.6% in May, showing signs of recovering after slowing dramatically during the COVID-19 crisis. Historically low mortgage rates likely boosted these figures. On the other hand, existing home sales fell 9.7% in May. This figure extends the declines seen in March and April but likely reflects earlier weaknesses. The outlook for June is positive, however.
|
 |
|
| Economic Indicators |
|
Last Week's Indicators:
(Summaries Appear Below)
Monday, June 22
Chicago Fed National Activity Index
Existing Home Sales
Tuesday, June 23
IHS Markit Flash U.S. Manufacturing PMI
New Home Sales
Richmond Fed Manufacturing Survey
Wednesday, June 24
None
Thursday, June 25
Durable Goods Orders and Shipments
Gross Domestic Product (First Quarter, Second Revision)
International Trade in Goods (Preliminary)
Kansas City Fed Manufacturing Survey
Weekly Initial Unemployment Claims
Friday, June 26
Personal Consumption Expenditures Deflator
Personal Income and Spending
University of Michigan Consumer Sentiment (Revision) |
|
|
|
This Week's Indicators:
Monday, June 29
Dallas Fed Manufacturing Survey
Tuesday, June 30
Conference Board Consumer Confidence
Wednesday, July 1
ADP National Employment Report
Construction Spending
ISM® Manufacturing Purchasing Managers’ Index®
Thursday, July 2
BLS National Employment Report
Factory Orders and Shipments
International Trade Report
Weekly Initial Unemployment Claims
Friday, July 3
None |
|
|
| Deeper Dive |
|
- Chicago Fed National Activity Index: After plunging to a record low in April, the Chicago Federal Reserve Bank’s National Activity Index rebounded strongly in May. The headline index jumped from -17.89 in April to 2.61 in May. The three-month moving average for the NAI registered -6.65 in May, improving somewhat from the all-time low of -7.50 in April. It marked the 16th straight month with the three-month moving average below zero, suggesting growth below the historical trend. Readings at -0.70 or lower are consistent with the U.S. economy being in a recession. At the same time, the steadying of the current indicator in May provides some cautious optimism that the nation might be beyond the worst of the downturn.
Employment and production helped the NAI recover in May. Manufacturing production rose 3.8% for the month, increasing modestly following sharp decreases in both March and April. Even with some improvement, output in the sector has fallen 16.5% year-over-year. At the same time, manufacturers added 225,000 workers in May, reversing some of the decline of 1,324,000 employees lost in April, and the U.S. economy added 2,509,000 nonfarm payroll workers for the month. The unemployment rate dropped from 14.7% in April to 13.3% in May. Consumer spending and housing also contributed positively to the NAI in May, with both bouncing back in the latest data.
- Durable Goods Orders and Shipments: New orders for durable goods jumped 15.8% in May, beginning the process of rebounding after plummeting 16.7% and 18.1% in March and April, respectively. Sharp bounce backs occurred for aerospace and automobiles, with transportation equipment sales soaring 80.7% for the month. Excluding transportation equipment, new orders rose 4% in May, with higher sales in every major category. Nondefense capital goods excluding aircraft—a proxy for capital spending in the U.S. economy—increased 2.3% in May, an improvement after declining 1.3% and 6.5% in March and April, respectively.
Even with progress in May, manufacturing activity remains well below its pre-recessionary pace. Over the past 12 months, new orders for durable goods have dropped 17.9%, or with transportation equipment excluded, sales have fallen 6.3% since May 2019. Core capital goods orders have also declined 3.8% year-over-year.
Meanwhile, shipments of durable goods rose 4.4% in May, with an increase of 2.3% without transportation equipment included. Since May 2019, durable goods shipments have fallen 20.1%, and excluding transportation, shipments have declined 7% year-over-year. At the same time, core capital goods shipments have decreased 7.1% over the past 12 months.
- Existing Home Sales: The National Association of Realtors reported that existing home sales fell 9.7% in May, extending the 8.5% and 17.8% declines in March and April, respectively. Over the past three months, existing home sales have plummeted from 5.76 million units at the annual rate in February, a 13-year high, to 3.91 million units in May, the slowest pace since October 2010. As such, the residential market for existing homes has slowed substantially due to the COVID-19 pandemic, with weaknesses in every region of the country.
In May, single-family and condominium and co-op sales fell 9.4% and 12.8%, respectively. Over the past 12 months, existing home sales have dropped 26.6%, with single-family and condo/co-op sales down 24.8% and 41.4%, respectively. With reduced activity, inventories swelled, up from 3.0 months of supply in February to 4.8 months in May. The median sales price for existing homes has increased 2.3% year-over-year, up to $284,600 in May.
Despite the weaker data in May, NAR Chief Economist Lawrence Yun felt optimistic that activity would rebound in the coming months. He noted that the May data reflected “contract signings in March and April—during the strictest times of the pandemic lockdown and hence the cyclical low point.” With the economy starting to reopen, existing home sales should bounce back strongly.
- Gross Domestic Product (Second Revision): The U.S. economy shrank by an annualized 5% in the first quarter, the largest quarterly decline since the fourth quarter of 2008 and unrevised from the previous estimate. The real GDP data for the second quarter will be worse, with the U.S. economy expected to contract by at least a mind-numbingly large 32.5% at the annual rate. Once the COVID-19 outbreak starts to abate, economic activity should improve, with real GDP rebounding strongly in the third quarter, currently estimated to be a gain of around 18%. Yet, the economic damage will have been done, with the U.S. economy declining 4.5% in 2020.
Highlights in the first quarter data:
- Personal consumption expenditures fell 6.8% at the annual rate, the fastest decline in consumer spending since the second quarter of 1980, with Americans staying closer to home and retail businesses closed or at limited capacity. Durable goods spending plummeted 13.8% at the annual rate in the first quarter, the most since the fourth quarter of 2008, but nondurable goods spending jumped 8% in the first quarter.
- The housing market was a bright spot for the third straight report. In the first quarter, residential investment jumped 18.2% at the annual rate.
- Nonresidential fixed investment fell 6.4% in the first quarter, the weakest reading since the second quarter of 2009, and dragging down GDP for the fourth straight quarter. Equipment spending dropped 16.6%.
- Businesses continued to spend less to stock their shelves, with inventories subtracting 1.56% from real GDP growth for the fourth consecutive quarter.
- Slowing global growth reduced trade activity, with goods exports and imports down 1.9% and 12.2% in the first quarter, respectively. Likewise, service-sector exports and imports plummeted 21.1% and 28.6%, respectively.
- IHS Markit Flash U.S. Manufacturing PMI: The manufacturing sector in the United States stabilized for the second consecutive month in June, continuing to bounce back from the fastest rate of decline in April since March 2009. The headline index has increased from 36.1 in April, to 39.8 in May, to 49.6 in June. While that continues to suggest a slight contraction in activity, progress occurred across the board, including for new orders, exports, output and employment. More importantly, the index for future output jumped from 45.2 in May to 61.7 in June, the best reading since February and a sign that manufacturers in the United States are optimistic for a rebound in the second half of this year. Input prices have also recovered, turning slightly positive after two months of declines.
Similarly, the IHS Markit Flash Eurozone Manufacturing PMI steadied in June, bouncing back for the second straight month after dropping in April at the quickest rate since February 2009. The index has risen from 33.4 in April, to 39.4 in May, to 46.9 in June, with progress across the board despite continuing weaknesses and ongoing sales and operational disruptions from the COVID-19 outbreak. Manufacturing activity continued to contract in Germany, albeit at a slower pace, but slight expansions occurred in France and, outside the European Union, the United Kingdom. Strength in output, which grew at the fastest rates since May 2018 and April 2019, respectively, led the improvements in France and Great Britain.
- International Trade in Goods (Preliminary): In advance statistics, the goods trade deficit rose from $70.73 billion in April to $74.34 billion in May. While both fell for the month, the decline in goods exports (down from $95.62 billion to $90.08 billion) was steeper than for goods imports (down from $166.34 billion to $164.42 billion). As the world grapples with the COVID-19 pandemic and a severe recession, goods exports were at the slowest pace since August 2009, and goods imports dropped to a level not seen since July 2010.
The reduction in goods exports in May stemmed largely from decreases in automotive vehicles, capital goods and industrial supplies. In contrast, the goods imports data for May provided mixed results, with declining activity for automotive vehicles and capital goods enough to offset increases for consumer goods and industrial supplies. Final data will be released July 2, which will also include the service-sector trade surplus.
- Kansas City Fed Manufacturing Survey: Manufacturing activity stabilized in the Kansas City Federal Reserve Bank’s district in June, steadying for the second straight month after contracting at the fastest pace in the survey’s history in April. The composite index has increased from -30 in April, to -19 in May, to 1 in June, with slight expansions for new orders, shipments and production and the average employee workweek improving to neutral. At the same time, employment and exports continued to decline, albeit at slower paces. The percentage of respondents saying that sales had risen for the month increased from 27% in May to 39% in June, with those suggesting that orders had fallen dropping from 46% to 31%.
In special questions, 76% of respondents had applied for the Small Business Administration’s Paycheck Protection Program, with 97% receiving the loan. Of those firms, 86% responded that the PPP loan had prevented layoffs and/or furloughs, with at least half suggesting that it helped to prevent wage reductions or to pay bills.
Turning to the outlook, manufacturers felt cautiously positive in their expectations for growth over the next six months, with the forward-looking composite index rising from -2 to 9, the best reading since February. Aside for exports, which remained negative, most of the other key underlying data indicated that firms anticipate a rebound in the second half of this year. Roughly half predict increased production, and at least one-quarter see increased hiring and capital spending.
- New Home Sales: After falling sharply in the prior three months, new single-family home sales soared 16.6% in the latest data, rising from 580,000 units in April to 676,000 units in May. New home sales increased in every region of the country except the Midwest. This suggests that the residential market has shown signs of recovering after slowing dramatically during the COVID-19 crisis, likely boosted by historically low mortgage rates. Over the past 12 months, new single-family home sales have risen 12.7%, up from 600,000 units in May 2019. With that said, the current pace remains below the 726,000 units in June 2019, which was the best reading since October 2007.
Inventories of new homes for sale have narrowed, declining from 6.7 months of supply on the market in April to 5.6 months in May, or just shy of the 5.5 months of supply in February. The median sales price was $317,900, up 1.7% from the $312,700 median one year ago.
- Personal Consumption Expenditures Deflator: The PCE deflator edged up 0.1% in May, increasing slightly after declining by 0.2% and 0.5% in March and April, respectively. This suggests that the deflationary pressures in the economy have stabilized slightly, but prices continue to reflect weak economic growth overall. The PCE deflator has risen 0.5% over the past 12 months, down from 0.6% in April and the lowest since December 2015.
Energy prices dropped 1.7% in May, falling for the fifth straight month and plummeting 18.5% year-over-year. In contrast, food costs rose 0.8% for the month, with a 4.5% gain since May 2019. The core PCE deflator, which excludes food and energy prices, inched up 0.1% in May. It registered 1% year-over-year in May, the same pace as in April, and remained the lowest since January 2011. The core PCE deflator has remained below the Federal Reserve’s stated goal of 2% core inflation for 17 straight months.
As such, inflationary pressures are not a current concern for the Federal Open Market Committee. Instead, especially in light of the COVID-19 crisis, the Federal Reserve is more concerned with contracting U.S. and global demand and deflation. Indeed, the Federal Reserve has undertaken extraordinary measures over the past few months to help prop up the economy and to address credit and liquidity concerns in financial markets.
- Personal Income and Spending: After plummeting by a record 12.6% in April, personal consumption expenditures jumped 8.2% in May, with Americans starting to emerge from their homes and increasing their purchasing. The savings rate, which had soared to an all-time high of 32.2% in April, declined to a still elevated 22.3% in May. This suggests that consumers remain cautious in their spending as the nation continues to grapple with the COVID-19 outbreak and a severe economic recession. To put that number in perspective, the savings rate averaged 7.9% in 2019. In May, Americans increased their spending on goods by 14.1%, with durable and nondurable goods consumption up 28.6% and 7.7%, respectively.
Despite the improvement, personal spending remains down 9.3% over the past 12 months, with goods consumption off 1.7% since May 2019. At the same time, service-sector consumption has declined 12.7% over the past 12 months.
Meanwhile, personal income decreased 4.2% in May, pulling back after skyrocketing by 10.8% in April. Government assistance checks continue to boost income for many Americans, but transfer payments from the government declined from $6.3 trillion in April to $5.2 trillion in May. (It was $3.3 trillion in March.) Overall, personal income has risen 7% since May 2019.
In May, employee compensation and proprietors’ income increased modestly, up 2.5% and 2.8%, respectively. However, these figures represent a decline of 5.9% and 12.5% year-over-year. Manufacturing wages and salaries rose from $796.5 billion in April to $830.1 billion in May, down by 8.7% from $909.5 billion one year earlier. With more activity starting to come back online, we expect these data to continue to improve in the coming months.
- Richmond Fed Manufacturing Survey: Manufacturing activity in the Richmond Federal Reserve Bank’s district stabilized in June, mirroring data in other regional surveys and continuing to bounce back from the lowest reading in the survey’s history in April. The composite index of general business activity rose from -27 in May to 0 in June. New orders, capacity utilization and the average workweek expanded slightly in June, and the rates of decline slowed for shipments, capital spending and employment. On an encouraging note, respondents forecasted demand, shipments and hiring to rebound over the next six months. The forward-looking index for shipments, for instance, jumped from 10 to 51, the best reading since March 2018.
Raw material costs also recovered, increasing from 1.05% at the annual rate in May to 1.59% in June. In addition, manufacturers predict stronger input price growth moving forward, with respondents expecting an annualized 2.36% increase six months from now, up from 1.87% in the prior survey.
- University of Michigan Consumer Sentiment: After falling in April to the lowest level since December 2011, consumer confidence rose for the second straight month, according to the University of Michigan and Thomson Reuters. The Index of Consumer Sentiment increased from 71.8 in April to 72.3 in May to 78.1 in June, with improved assessments for both the current economic environment and the outlook. With that said, the Index of Consumer Sentiment for June was originally estimated to be 78.9, which indicates a little slippage in the past two weeks.
Overall, the headline index remains well below the levels seen before the COVID-19 outbreak, with a reading of 101.0 in February. Respondents to the latest survey continue to express a record high level of uncertainty regarding income.
- Weekly Initial Unemployment Claims: There were 1,480,000 initial unemployment claims for the week ending June 20, down slightly from the 1,540,000 claims added for the week ending June 13. Initial claims have continued to decelerate since peaking at 6,867,000 for the week ending March 28 but remain highly elevated. Over the past 14 weeks, 47,250,000 Americans have filed for unemployment insurance, illustrating the unprecedented and severe hardships seen in the labor market due to the COVID-19 pandemic and the ensuing global recession.
Meanwhile, continuing claims declined from 20,289,000 for the week ending June 6 to 19,522,000 for the week ending June 13 in this report, with 13.4% of the workforce receiving unemployment insurance for the week.
|
Thank you for subscribing to the NAM’s Monday Economic Report.
If you’re part of an NAM member company and not yet subscribed, email us. If you’re not an NAM member, become one today!
|
|
|
|
|
|
|
|
|
| Interested in becoming a presenter of the Monday Economic Report? Email us. |
|
| Questions or comments? Email NAM Chief Economist Chad Moutray at [email protected]. |
|
| You received this email because you signed up for the NAM’s Monday Economic Report as a part of your NAM membership. |
|
| Manage my email newsletters and alerts | Unsubscribe |
|
 |
|
| © 2020 National Association of Manufacturers |
|
|
|
|
|
|
|
