 |
| If you’re having trouble reading this, click here. |
|
| MONDAY ECONOMIC REPORT |
|
|
|
|
| Essential Takes on Leading Economic Indicators |
|
By Chad Moutray, Ph.D., CBE – August 10, 2020– SHARE


|
|
<
|
|
|
| Manufacturers Employment Rose in July, but Still Off 740,000 Since February |
|
| The Weekly Toplines |
|
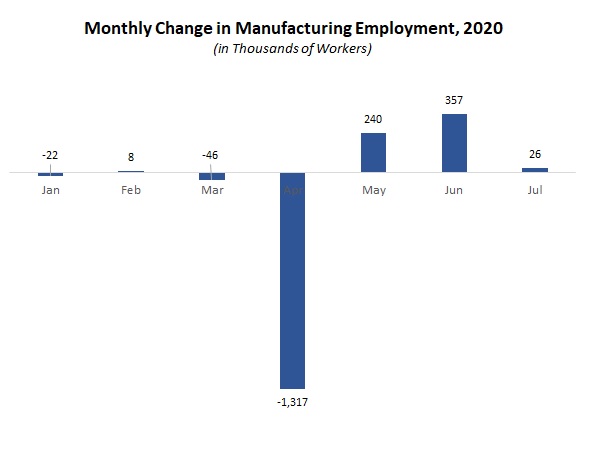
- Manufacturers added 26,000 workers in July, slowing from gains of 240,000 and 357,000 in May and June, respectively, but still a solid increase. Despite the increases seen over the past three months, however, manufacturing employment was down by 740,000 in July relative to the level seen in February, illustrating the steep climb still needed to get back to prepandemic levels.
- The U.S. economy added 1,763,000 workers in July, but the nonfarm sector has lost 12,881,000 jobs since February. The unemployment rate declined from 11.1% in June to 10.2% in July.
- The current outlook is for manufacturing employment to bounce back to roughly 12,450,000 million workers by year’s end, with an unemployment rate around 9%.
- The Institute for Supply Management® reported that manufacturing activity continued to rebound in July, expanding at the fastest pace since March 2019. The headline index was buoyed by strong growth for new orders and production, both of which had their best readings since autumn 2018. Employment remained weak, though, continuing to decline significantly.
- New orders for manufactured goods increased 6.2% in June, extending the 7.7% gain in May, as the sector tries to recover from severe COVID-19 disruptions in March and April. Durable and nondurable goods sales rose 7.6% and 5.0% in June, respectively. Yet, new factory orders have fallen by a sharp 10.6% since June 2019.
- The U.S. trade deficit declined from $54.80 billion in May, the highest point since December 2018, to $50.70 billion in June, with growth in goods exports rising faster than goods imports. Yet, U.S.-manufactured goods exports were off 17.17% year-to-date in 2020 relative to activity in the first half of 2019.
- After declining for six straight months, private manufacturing construction spending rose 1.7% from $70.86 billion in May to $72.07 billion in June. However, activity has fallen 9.1% year-over-year.
- We will be watching several key indicators this week, including updates on consumer and producer prices, industrial production, job openings and retail sales, among others. Manufacturing production was 11.1% lower in June than in February, and we will be looking for the sector to increase output in July. However, the sector still has a large gap to overcome to get back to the pace seen before the COVID-19 pandemic.
|
 |
|
| Economic Indicators |
|
Last Week’s Indicators:
(Summaries Appear Below)
Monday, August 3
Construction Spending
ISM® Manufacturing Purchasing Managers’ Index®
Tuesday, August 4
Factory Orders and Shipments
Wednesday, August 5
ADP National Employment Report
International Trade Report
Thursday, August 6
Weekly Initial Unemployment Claims
Friday, August 7
BLS National Employment Report |
|
|
|
This Week's Indicators:
Monday, August 10
Job Openings and Labor Turnover Survey
Tuesday, August 11
NFIB Small Business Survey
Producer Price Index
Wednesday, August 12
Consumer Price Index
Thursday, August 13
Weekly Initial Unemployment Claims
Friday, August 14
Industrial Production
Productivity and Costs
Retail Sales
University of Michigan Consumer Sentiment |
|
|
| Deeper Dive |
|
- ADP National Employment Report: Manufacturing employment rose by 10,000 in July, slowing from the 253,000 and 307,000 gains in May and June, respectively, according to ADP estimates. Despite three months of job growth, the sector has lost 761,496 workers since February, with manufacturers still trying to recover from severe declines in activity due to the COVID-19 pandemic and the global recession. Job growth should continue to return in the coming months as restrictions are eased and economic activity accelerates, albeit likely at a slower pace than preferred.
Overall, there were just 167,000 additional nonfarm private business employees in July, well below the consensus estimate of roughly 1 million gains for the month and easing from an increase of 4,314,000 in June. (The June figure was originally 2,369,000, marking a sizable upward revision to what was reported previously.) Still, even with recent progress, the labor market remains down 11,889,357 workers since February, illustrating the jaw-dropping losses in employment experienced over the spring months.
In July, the largest job growth occurred in education and health services; leisure and hospitality; professional and business services; and trade, transportation and utilities. Jobs declined in the construction, information and mining sectors for the month. Meanwhile, small (i.e., those with fewer than 50 employees) and large (i.e., those with 500 or more employees) manufacturers added workers in July, but medium-sized establishments (i.e., those with 50 to 499 employees) lost workers in the latest data.
- BLS National Employment Report: Manufacturers added 26,000 workers in July, slowing from gains of 240,000 and 357,000 in May and June, respectively, but still a solid increase. The jobs market continues to show signs of stabilization as economic activity starts to resume from the COVID-19 crisis, even as overall employment remains well below prerecessionary levels. Despite the increases seen over the past three months, however, manufacturing employment was down by 740,000 in July relative to the level seen in February.
In July, durable and nondurable goods employment rose by 15,000 and 11,000, respectively. The largest gains were seen in motor vehicles and parts (up 39,300, with transportation equipment as a whole up 33,200), miscellaneous durable goods (up 12,000), miscellaneous nondurable goods (up 9,000) and food manufacturing (up 7,000). In contrast, notable declines occurred in the workforce for fabricated metal products (down 11,000), machinery (down 7,000), computer and electronic products (down 6,000), chemicals (down 5,000) and electrical equipment and appliances (down 5,000).
All 19 major sectors in manufacturers have seen net declines between February and July, illustrating the hill that still needs to be climbed to get back to prepandemic levels. The following sectors continue to experience the largest decreases over that five-month period:
- Transportation equipment (down 121,000, with motor vehicles and parts down 70,800)
- Fabricated metal products (down 98,000)
- Machinery (down 71,000)
- Food manufacturing (down 62,000)
- Printing and related support services (down 38,000)
- Primary metals (down 37,000)
- Miscellaneous durable goods (down 34,000)
Meanwhile, the U.S. economy added 1,763,000 workers in July, building on the increases of 2,725,000 and 4,791,000 workers seen in May and June, respectively. Yet, the labor market remains significantly weaker than it did before the COVID-19 pandemic even with notable gains over the past three months, with nonfarm payrolls down by 12,881,000 since February.
The unemployment rate declined from 11.1% in June to 10.2% in July, with the number of unemployed workers falling from 17,750,000 to 16,338,000. In addition, the so-called “real unemployment rate”—a term that refers to those marginally attached to the workforce, including discouraged workers and the underemployed—declined from 18% to 16.5%.
Yet, there were increases in the number of employees who could only find part-time work (up from 942,000 to 1,048,000) and those who had to work part-time for noneconomic reasons such as childcare, school or family issues (up from 16,793,000 to 17,404,000). In addition, the participation rate in the labor force edged down from 61.5% to 61.4%.
The current outlook is for manufacturing employment to bounce back to roughly 12,450,000 million workers by year’s end, with an unemployment rate around 9%.
- Construction Spending: After declining for six straight months, private manufacturing construction spending rose 1.7% from $70.86 billion in May to $72.07 billion in June. Despite the uptick in the latest data, construction in the sector has pulled back dramatically in recent months as manufacturers have grappled with the COVID-19 pandemic and a severe global recession. On a year-over-year basis, private construction spending among manufacturers has decreased 9.1% since June 2019.
Meanwhile, total private construction spending fell 0.7% in June. Private residential activity declined 1.5%, with single-family construction spending off 3.6% for the month. In contrast, private nonresidential construction edged up 0.2% in June. Sizable declines in construction for amusement and recreation (down 6.2%) and commercial (down 1.3%) were offset by increased spending for health care (up 1.7%), manufacturing (up 1.7%), lodging (up 1.1%) and power (up 0.7%) projects, among others. Nonetheless, private residential and nonresidential construction declined 0.8% and 3.2% year-over-year.
Public construction spending fell 0.7% in June, but with 6.2% growth over the past 12 months.
- Factory Orders and Shipments: New orders for manufactured goods increased 6.2% in June, extending the 7.7% gain in May, as the sector tries to recover from severe COVID-19 disruptions in March and April. Durable and nondurable goods sales rose 7.6% and 5.0% in June, respectively. Transportation equipment demand soared 20.2% in June, with motor vehicle and parts orders up 27.8%. Excluding transportation equipment, new factory orders increased 4.4%, and durable goods sales excluding transportation rose 3.6% for the month.
Despite progress in May and June, the pace of orders remains well below the prerecessionary pace. On a year-over-year basis, new orders in the manufacturing sector have fallen by a sharp 10.6% since June 2019. With transportation equipment excluded, factory sales have fallen 7.1% year-over-year. Moreover, new orders for core capital goods (or nondefense capital goods excluding aircraft)—a proxy for capital spending in the U.S. economy—rose 3.4% in June, but with a decline of 3.4% over the past 12 months.
Meanwhile, factory shipments rose 3.0% and 9.8% in May and June, respectively, following steep decreases in the prior two months. Shipments of durable and nondurable goods increased 15.1% and 5.0% in June, respectively. With transportation equipment excluded, shipments increased 4.4% for the month. Since June 2019, manufactured goods shipments have decreased 9.1%, or a decline of 7.0% without transportation equipment included. Core capital goods shipments have fallen 3.9% year-over-year.
- International Trade Report: The U.S. trade deficit declined from $54.80 billion in May, the highest point since December 2018, to $50.70 billion in June. Trade volumes fell dramatically in the spring months as economies slowed globally amid the COVID-19 pandemic. In June, the trade deficit’s decrease can be attributed to goods exports (up from $89.85 billion to $102.87 billion) rising faster than goods imports (up from $166.03 billion to $175.02 billion), even as both rose significantly for the month. To be fair, trade volumes remain sharply lower year to date, with goods exports and imports at $137.65 billion and $207.63 billion in December 2019, respectively. In addition, the service-sector trade surplus has also fallen over the past six months, down from $24.30 billion at the end of last year to $21.46 billion in June.
The June goods exports data were boosted by solid growth for automotive vehicles, parts and engines (up $4.91 billion), consumer goods (up $1.35 billion), industrial supplies and materials (up $2.84 billion) and non-automotive capital goods (up $3.77 billion), but declining exports for soybeans and meat helped pull foods, feeds and beverages activity lower (down $470 million). At the same time, increased imports for automotive vehicles, parts and engines (up $9.67 billion), consumer goods (up $4.75 billion) and non-automotive capital goods (up $2.25 billion) were enough to offset very large import declines for industrial supplies and materials (down $8.29 billion).
In non-seasonally adjusted data, U.S.-manufactured goods exports totaled $468.03 billion through the first half of 2020, dropping 17.17% from $565.03 billion for the same time frame in 2019.
- ISM® Manufacturing Purchasing Managers’ Index®: The Institute for Supply Management® reported that manufacturing activity continued to rebound in July, expanding at the fastest pace since March 2019. The headline index rose from 52.6 in June to 54.2 in July, buoyed by strong growth for new orders (up from 56.4 to 61.5) and production (up from 57.3 to 62.1), both of which had their best readings since autumn 2018. Exports (up from 47.6 to 50.4) have also recovered, expanding for the first time since February, following sharp reductions over the previous four months. In contrast to those measures, employment (up from 42.1 to 44.3) continued to decline significantly even with some progress in the latest data.
Raw material prices (up from 51.3 to 53.2) also reflect the steadying of economic activity in June and July, with input costs expanding modestly following springtime deflationary pressures. At the same time, 61.2% of respondents said that prices did not change in July relative to June.
Meanwhile, inventories (down from 50.5 to 47.0) fell in July following increases in May and June. Timothy Fiore, chair of the ISM® Manufacturing Business Survey Committee, attributed the latest decline to “continuing supplier difficulties” and uncertainties in the economic outlook.
- Weekly Initial Unemployment Claims: Initial unemployment claims declined from 1,435,000 for the week ending July 25 to 1,186,000 for the week ending Aug. 1, the lowest level in 20 weeks. Initial claims have decelerated overall since peaking at 6,867,00 for the week ending March 28, but remain highly elevated, illustrating continuing pain in the labor market.
Along those lines, continuing claims dropped from 16,951,000 for the week ending July 18 to 16,107,000 for the week ending July 25. As such, 11.0% of the workforce was receiving unemployment insurance in the latest data, down from 11.6% in the previous report.
Meanwhile, 12,956,478 Americans received Pandemic Unemployment Assistance for the week ending July 18, with 1,144,429 individuals obtaining Pandemic Emergency Unemployment Compensation. The Federal Pandemic Unemployment Compensation program provided an additional $600 per week to individuals who are collecting regular UC before expiring on July 31. Congress and the White House are currently negotiating terms for a potential extension of additional federal unemployment benefits.
|
|
| Upcoming Webinar |
|
"State of the Industry: The Impact of COVID-19 on Manufacturing, August Update"
Tuesday, Aug. 25
1:00 p.m. – 2:00 p.m. EDT
Click here to register.
Panelists:
- Graham Immerman, Vice President of Marketing, MachineMetrics (moderator)
- Chad Moutray, Chief Economist, NAM
- Jerry Foster, Chief Technology Officer, Plex Systems, Inc.
- Lou Zhang, Chief Data Scientist, MachineMetrics
The COVID-19 pandemic has caused widespread concern and economic hardship for consumers, businesses and communities around the world. The situation is fast-moving, with widespread impacts. One thing is for certain—it has and will continue to have global economic and financial ramifications that will be felt throughout the manufacturing industry. So, how has COVID-19 affected the near-term global manufacturing supply chain today? How will it be affected moving forward? How do we reshape and rebuild an industry that is both more sustainable and resilient for the future? This webinar will focus on how economic trends have changed since the previous one in June. |
|
|
Thank you for subscribing to the NAM’s Monday Economic Report.
If you’re part of an NAM member company and not yet subscribed, email us. If you’re not an NAM member, become one today!
|
|
|
|
|
|
|
|
|
| Interested in becoming a presenter of the Monday Economic Report? Email us. |
|
| Questions or comments? Email NAM Chief Economist Chad Moutray at [email protected]. |
|
| You received this email because you signed up for the NAM’s Monday Economic Report as a part of your NAM membership. |
|
| Manage my email newsletters and alerts | Unsubscribe |
|
 |
|
| © 2020 National Association of Manufacturers |
|
|
|
|
|
|
|
