 |
| If you’re having trouble reading this, click here. |
|
| MONDAY ECONOMIC REPORT |
|
|
|
|
| Essential Takes on Leading Economic Indicators |
|
By Chad Moutray, Ph.D., CBE – September 8, 2020– SHARE


|
|
<
|
|
|
| Manufacturers Added 29K Workers in August; Sector Off 720K Since February |
|
| The Weekly Toplines |
|
- Manufacturers added 29,000 workers in August, slowing but extending the 41,000 gain in employment in July. Despite increases over the past four months, the labor market remains well below its pre-COVID-19 pace, with manufacturing employment down 720,000 since February. As such, sizable labor market challenges continue despite recent progress.
- The current outlook is for manufacturing employment to bounce back to roughly 12,350,000 workers by year’s end, up from 12,132,000 in August but down from the prepandemic pace of 12,852,000 in February.
- Meanwhile, the U.S. economy added 1,371,000 workers in August, with the unemployment rate dropping for the fourth straight month to 8.4%.
- Initial unemployment claims declined from 1,011,000 for the week ending Aug. 22 to 881,000 for the week ending Aug. 29. Overall, initial claims have decelerated since peaking at 6,867,000 for the week ending March 28, averaging 1,031,600 over the past five weeks.
- The ISM® Manufacturing Purchasing Managers’ Index® expanded in August at the fastest pace since November 2018, with the sector continuing to recover from sharp declines from COVID-19 disruptions in the spring. New orders grew at the best rate since January 2004, even as hiring declined for the 13th straight month.
- On a regional level, the Dallas Federal Reserve reported that manufacturing activity continued to stabilize, expanding for the first time since February, with respondents optimistic about the next six months.
- New orders for manufactured goods increased 6.4% in July, or 2.1% with transportation equipment excluded. Over the past 12 months, factory orders have fallen 4.9%, but encouragingly, core capital goods—a proxy for capital spending in the economy—have declined just 0.2% year-over-year after recent rebounds. Shipments rose 4.6% in July.
- The U.S. trade deficit rose to the highest level since July 2008, with the goods trade deficit soaring to a new record. Growth in goods imports outpaced the gains in goods exports. The data continue to reflect the drop-off in trade activity year to date, with U.S.-manufactured goods exports down 17.3% through the first seven months of 2020 relative to the same period in 2019.
- Private manufacturing construction spending edged up 0.2% in July, but on a year-over-year basis, private construction spending among manufacturers has decreased 9.9% since July 2019.
|
 |
|
| Economic Indicators |
|
Last Week’s Indicators:
(Summaries Appear Below)
Monday, August 31
Dallas Fed Manufacturing Survey
Tuesday, September 1
Construction Spending
ISM® Manufacturing Purchasing Managers’ Index®
Wednesday, September 2
ADP National Employment Report
Factory Orders and Shipments
Thursday, September 3
International Trade Report
Productivity and Costs (Revision)
Weekly Initial Unemployment Claims
Friday, September 4
BLS National Employment Report |
|
|
|
This Week's Indicators:
Monday, September 7
LABOR DAY HOLIDAY
Tuesday, September 8
Consumer Credit
NFIB Small Business Survey
Wednesday, September 9
Job Openings and Labor Turnover Survey
Thursday, September 10
Producer Price Index
Weekly Initial Unemployment Claims
Friday, September 11
Consumer Price Index |
|
|
| Deeper Dive |
|
- ADP National Employment Report: Manufacturing employment rose by 9,000 in August, slowing from the gain of 18,000 in July but increasing for the fourth straight month, according to ADP estimates. Despite recent job growth, the sector has lost 734,435 workers since February, with manufacturers still trying to recover from severe declines in activity due to the COVID-19 pandemic and global recession. Job growth should continue to return in the coming months as economic activity accelerates, albeit likely at a slower pace than preferred.
Overall, there were 428,000 additional nonfarm private business employees in August, building on the increase of 212,000 in July but well below the consensus estimate of roughly 1,200,000. Like the manufacturing numbers, the labor market has bounced back since dropping sharply in the spring, and even with more employees added over the past four months, there were 11,244,035 fewer workers in August than in February.
In August, the largest job growth occurred in construction; education and health services; leisure and hospitality; professional and business services; and trade, transportation and utilities. Meanwhile, nearly 70% of the net job gains in August came from large establishments (i.e., those with 500 or more employees), suggesting some lingering challenges for small and medium-sized businesses.
- BLS National Employment Report: Manufacturers added 29,000 workers in August, slowing but extending the 41,000 gain in employment in July. Despite increases over the past four months, the labor market remains well below its pre-COVID-19 pace, with manufacturing employment down by 720,000 in August relative to the level in February. As such, sizable challenges in the economic environment continue despite movement in the right direction. The current outlook is for manufacturing employment to bounce back to roughly 12,350,000 workers by year’s end, up from 12,132,000 in August but down from the prepandemic pace of 12,852,000 in February.
In August, durable and nondurable goods employment rose by 2,000 and 27,000, respectively. The largest gains occurred in food manufacturing (up 12,100), plastics and rubber products (up 6,500), fabricated metal products (up 5,900), furniture and related products (up 5,700) and chemicals (up 5,500). In contrast, notable declines in the workforce occurred in transportation equipment (down 8,400, including a decrease of 5,300 for motor vehicles and parts), nonmetallic mineral products (down 4,400) and printing and related support activities (down 4,100), among others.
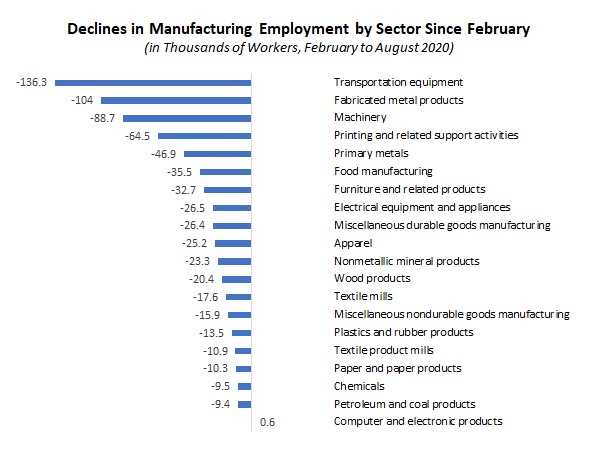
There were 600 more employees in the computer and electronic products sector in August than in February, but all of the other 19 major sectors continue to experience lower employment since February. The following sectors have the largest decreases over that six-month period: transportation equipment (down 136,300, with motor vehicles and parts down 93,800), fabricated metal products (down 104,000), machinery (down 88,700), printing and related support services (down 64,500) and primary metals (down 46,900).
Meanwhile, the U.S. economy added 1,371,000 workers in August, building on the 1,734,000 workers added in July. With that said, nonfarm payrolls remain down 11,549,000 since February, highlighting ongoing challenges in the labor market despite sizable improvements since the spring. The unemployment rate dropped for the fourth straight month from 10.2% in July to 8.4% in August, with the number of unemployed workers falling from 16,338,000 to 13,550,000. In addition, the so-called “real unemployment rate”—a term that refers to those marginally attached to the workforce, including discouraged workers and the underemployed—declined from 16.5% to 14.2%. The participation rate in the labor force increased from 61.4% to 61.7%.
- Construction Spending: Private manufacturing construction spending edged up 0.2% from $72.28 billion in June to $72.46 billion in July. Despite the slight uptick in the latest data, construction in the sector has pulled back dramatically in recent months as manufacturers have grappled with the COVID-19 pandemic and a severe global recession. On a year-over-year basis, private construction spending among manufacturers has decreased 9.9% since July 2019.
Meanwhile, total private construction spending increased 0.6% in July. Private residential activity rose 2.1%, with single-family and multifamily activity up 3.1% and 4.9% for the month, respectively. In contrast, private nonresidential construction fell 1.0% in July. Sizable declines occurred for religious (down 5.0%), health care (down 3.4%), commercial (down 3.2%), amusement and recreation (down 2.3%) and lodging (down 2.0%) projects, among others. In contrast, higher private construction spending occurred in the transportation (up 3.2%) and communication (up 1.2%) sectors in July. Overall, private nonresidential construction declined 4.3% year-over-year, but private residential activity has risen 0.5% since July 2019.
Public construction spending fell 1.3% in July, but with 5.1% growth over the past 12 months.
- Dallas Fed Manufacturing Survey: The Dallas Federal Reserve reported that manufacturing activity continued to stabilize, expanding for the first time since February, with the composite index of general business activity rising from -3 in July to 8 in August. The sector has bounced back from very sharp declines in the spring due to the COVID-19 pandemic and falling energy prices. In August, the underlying measures provided mixed results. The pace of growth for new orders, shipments, employment and hours worked accelerated for the month, but production and capacity utilization slowed somewhat. Capital spending was neutral following steep declines since February, and raw material costs grew at the fastest rate in 10 months.
Encouragingly, manufacturers in the district felt optimistic in their outlook for the next six months, with the forward-looking composite index of business conditions improving from 18.7 in July to 27.8 in August, the best reading since November 2018. More than 54% of respondents expect demand to increase over the next six months, with 34.9% and 26.4% anticipating more hiring and capital investment, respectively.
- Factory Orders and Shipments: New orders for manufactured goods increased 6.4% in July, building on the 7.7% and 6.4% gains in May and June, respectively, as the sector continues to recover from severe COVID-19 disruptions in March and April. Durable and nondurable goods sales rose 11.4% and 1.8% in July, respectively. Transportation equipment demand soared 35.7% in July, boosted by strong growth for motor vehicle parts (up 9.4%) and defense aircraft and parts (up 77.1%) orders. Excluding transportation equipment, new factory orders increased 2.1%, and durable goods sales excluding transportation rose 2.6% for the month.
Despite improvements over the past three months, the pace of orders remains below the pre-COVID-19 pace. On a year-over-year basis, new orders in the manufacturing sector have fallen 6.2% since July 2019. With transportation equipment excluded, factory sales have fallen 4.9% year-over-year. Encouragingly, new orders for core capital goods (or nondefense capital goods excluding aircraft)—a proxy for capital spending in the U.S. economy—rose 1.9% in July, but with a decline of just 0.2% over the past 12 months.
Meanwhile, factory shipments have risen 3.0%, 10.0% and 4.6% in May, June and July, respectively, following steep decreases in the spring. Shipments of durable and nondurable goods increased 7.5% and 1.8% in July, respectively. With transportation equipment excluded, shipments rose 2.2% for the month. Since July 2019, manufactured goods shipments have decreased 4.4%, or a decline of 4.8% without transportation equipment included. Yet, core capital goods shipments have fallen 0.4% year-over-year.
- International Trade Report: The U.S. trade deficit rose to the highest level since July 2008, jumping from $53.46 billion in June to $63.56 billion in July. Goods imports increased from $174.83 billion to $196.37 billion, the best reading since February. That was enough to outpace the growth in goods exports, which rose from $103.18 billion to $115.46 billion, a four-month high. More importantly, the goods trade deficit soared from $71.65 billion to $80.91 billion, a new record. In addition, the service-sector trade surplus has fallen over the course of this year, down from $24.30 billion at the end of last year to $17.35 billion in July, the lowest level since August 2012.
In July, strong growth in goods exports occurred for automotive vehicles, parts and engines (up $3.85 billion), consumer goods (up $2.60 billion), industrial supplies and materials (up $2.51 billion) and non-automotive capital goods (up $2.47 billion). For comparison, goods imports growth was also very solid in the same categories: automotive vehicles, parts and engines (up $7.73 billion), industrial supplies and materials (up $4.35 billion), non-automotive capital goods (up $4.07 billion) and consumer goods (up $3.55 billion).
In non-seasonally adjusted data, U.S.-manufactured goods exports totaled $543.41 billion through the first seven months of 2020, dropping 17.27% from $656.86 billion for the same time frame in 2019.
- ISM® Manufacturing Purchasing Managers’ Index®: The Institute for Supply Management® reported that manufacturing activity expanded in August at the fastest pace since November 2018, with the sector continuing to recover from sharp declines from COVID-19 disruptions in the spring. The sample comments, however, note lingering uncertainties in the outlook. The headline index rose from 54.2 in July to 56.0 in August, buoyed by strong growth for new orders (up from 61.5 to 67.6), which registered the best reading since January 2004. Production (up from 62.1 to 63.3) also grew solidly at a rate not seen since January 2018. In addition, the backlog of orders (up from 51.8 to 54.6) and exports (up from 50.4 to 53.3) accelerated in August, expanding modestly. On the other hand, employment (up from 44.3 to 46.5) continued to decline—for the 13th straight month—even with some progress in the latest data.
Raw material prices (up from 53.2 to 59.5) also reflect stronger economic activity, with input rising following springtime deflationary pressures. At the same time, 64.3% of respondents said that prices did not change in August relative to July.
Meanwhile, inventories (down from 47.0 to 44.4) declined for the second straight month, falling at the fastest pace since January 2014. Timothy Fiore, chair of the ISM® Manufacturing Business Survey Committee, attributed the latest decrease to continuing supplier difficulties despite the pickup in overall production.
- Productivity and Costs (Revision): Manufacturing labor productivity fell 14.6% at the annual rate in the second quarter, according to revised data, the largest decline on record since the data series began in 1987. With the U.S. economy grappling with the economic impacts of COVID-19, output plummeted at unprecedented levels, down by a sharp annualized 47.0% for the quarter. The number of hours worked decreased 38.0%, with unit labor costs soaring 29.1%. Labor productivity in the second quarter for durable and nondurable goods manufacturers dropped 26.9% and 5.1%, respectively, while output decreased at jaw-dropping rates, off 57.9% and 33.5%, respectively.
Meanwhile, nonfarm business labor productivity rose by an annualized 10.1% in the second quarter, the best reading since the first quarter of 1971. With that said, output fell by a record-setting 37.1% for the quarter (dating back to 1947), with hours worked dropping by 42.9%. Unit labor costs increased 9.0% in the second quarter, building on the 9.6% gain in the first quarter, which was a six-year high.
- Weekly Initial Unemployment Claims: Initial unemployment claims declined from 1,011,000 for the week ending Aug. 22 to 881,000 for the week ending Aug. 29. Overall, initial claims have decelerated since peaking at 6,867,000 for the week ending March 28, averaging 1,031,600 over the past five weeks. However, they remain highly elevated, illustrating continuing pain in the labor market. To put the current numbers in perspective, initial claims peaked during the Great Recession at 665,000 for the week ending March 28, 2009.
Meanwhile, continuing claims dropped from 14,492,000 for the week ending Aug. 15 to 13,254,000 for the week ending Aug. 22. That was the lowest level since the week ending March 28. As such, 9.1% of the workforce received unemployment insurance in the latest data, down from 9.9% in the previous report.
|
|
|
Thank you for subscribing to the NAM’s Monday Economic Report.
If you’re part of an NAM member company and not yet subscribed, email us. If you’re not an NAM member, become one today!
|
|
|
|
|
|
|
|
|
|
|

