 |
| If you’re having trouble reading this, click here. |
|
| MONDAY ECONOMIC REPORT |
|
|
|
|
| Essential Takes on Leading Economic Indicators |
|
By Chad Moutray, Ph.D., CBE – September 28, 2020– SHARE


|
|
<
|
|
|
Core Capital Goods Orders Rose to Highest Level Since July 2018 |
|
| The Weekly Toplines |
|
- New orders for durable goods rose 0.4% in August, extending the 11.7% gain in July and rising for the fourth straight month despite growing well below the consensus estimate of around 1.5%. Overall, the durable goods manufacturing sector has continued to rebound from steep declines in March and April due to the COVID-19 pandemic, but current activity remains off 4.6% from the pace in August 2019.
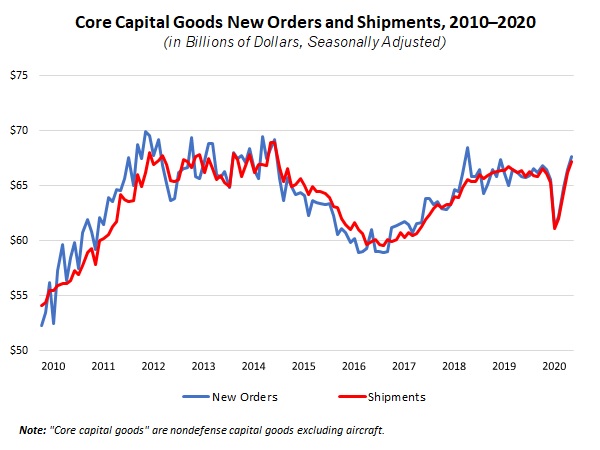
- Despite the slower-than-expected headline number for durable goods, nondefense capital goods excluding aircraft (or “core capital goods”)—a proxy for capital spending in the U.S. economy—rose 1.8% to the highest level since July 2018 and increased 2.8% year-over-year.
- The IHS Markit Flash U.S. Manufacturing PMI notched the best reading since January 2019, bouncing back from springtime declines that were the worst since the Great Recession. Manufacturers remained cautiously upbeat about continued increases in production, albeit with some easing in September’s survey. Regional surveys from the Kansas City and Richmond Federal Reserve Banks also reported continuing expansions in activity in September.
- Meanwhile, the IHS Markit Flash Eurozone Manufacturing PMI rose to the best reading since August 2018, but overall business activity in Europe slowed to a near halt in September, with the Flash Eurozone PMI Composite Output Index dropping from 51.9 to 50.1 on renewed contractions in the service sector.
- Existing and new home sales both rose at the fastest paces since 2006 in the latest data, buoyed by historically low mortgage rates. Overall, the housing market remains a bright spot in the economy, but inventories of homes for sale remain very low.
- Initial unemployment claims changed little, totaling 870,000 for the week ending Sept. 19. Unemployment remains stubbornly high, averaging nearly 973,750 over the past eight weeks. Meanwhile, there were 12,580,000 continuing claims for the week ending Sept. 12, which was consistent with 8.6% of the workforce.
- There were 26,044,952 Americans receiving some form of unemployment insurance benefit for the week ending Sept. 5, down from 29,768,465 for the week ending Aug. 29.
|
 |
|
| Economic Indicators |
|
Last Week’s Indicators:
(Summaries Appear Below)
Monday, September 21
Chicago Fed National Activity Index
Tuesday, September 22
Existing Home Sales
Richmond Fed Manufacturing Survey
Wednesday, September 23
IHS Markit Flash U.S. Manufacturing PMI
Thursday, September 24
Kansas City Fed Manufacturing Survey
New Home Sales
Weekly Initial Unemployment Claims
Friday, September 25
Durable Goods Orders and Shipments |
|
|
|
This Week's Indicators:
Monday, September 28
Dallas Fed Manufacturing Survey
Tuesday, September 29
Conference Board Consumer Confidence
International Trade in Goods (Preliminary)
Wednesday, September 30
ADP National Employment Report
Gross Domestic Product (Second Revision)
Real GDP by Industry
Thursday, October 1
Construction Spending
ISM® Manufacturing Purchasing Managers’ Index®
Personal Consumption Expenditures Deflator
Personal Income and Spending
Weekly Initial Unemployment Claims
Friday, October 2
BLS National Employment Report
Factory Orders and Shipments
University of Michigan Consumer Sentiment (Revision) |
|
|
| Deeper Dive |
|
- Chicago Fed National Activity Index: The Chicago Federal Reserve Bank’s National Activity Index slowed from 2.54 in July to 0.79 in August, but the data continue to reflect a rebounding economy following severe pullbacks due to COVID-19. Indeed, the three-month moving average registered 3.05 in August, a solid figure despite pulling back from 4.23 in July, which was an all-time high. Readings above zero are consistent with the U.S. economy expanding above its historical trend. This report provides encouragement that the nation is beyond the worst of the recession, even as challenges persist.
Manufacturing production eased in August, rising 1.0% for the month, but continued to be a positive contributor to the NAI, adding 0.23. Still, the sector’s output remains 6.7% below pre-pandemic levels. Likewise, manufacturers have added 643,000 workers over the past four months, but there remain 720,000 fewer workers since February. The unemployment rate fell to 8.4%, which was still elevated but reflects progress in the labor market since April. Employment-related indicators contributed the most to the NAI in August, adding 0.63 to the headline measure.
- Durable Goods Orders and Shipments: New orders for durable goods rose 0.4% in August, extending the 11.7% gain in July and rising for the fourth straight month despite growing well below the consensus estimate of around 1.5%. Overall, the durable goods manufacturing sector has continued to rebound from steep declines in March and April due to the COVID-19 pandemic. Despite the slower-than-expected headline number, nondefense capital goods excluding aircraft—a proxy for capital spending in the U.S. economy—rose 1.8% from $66.48 billion in July to $67.70 billion in August, the highest level since July 2018.
Since April’s low, new durable goods orders have come back strongly but remain down 4.6% year-over-year in August 2019. With transportation equipment excluded, new orders eked out a 0.1% gain year-over-year. Core capital goods orders have risen 2.8% over the past 12 months—a significant rebound from the 7.3% year-over-year decline in April. In August, new orders rose for computers and electronic products, machinery, primary metals and other durable goods, but sales declined for defense aircraft and parts, electrical equipment, appliances and components, fabricated metal products and motor vehicles and parts.
Meanwhile, shipments of durable goods declined 0.3% in August, pulling back after sizable increases in the prior three months. Transportation equipment shipments fell 1.7% in August, and with those items excluded, durable goods shipments rose 0.5%. Over the past 12 months, durable goods shipments have fallen 1.5%, and excluding transportation, shipments have inched down 0.1% year-over-year. In addition, core capital goods shipments have risen 1.2% since August 2019, a nice turnaround after falling 8.1% year-over-year in April.
- Existing Home Sales: The National Association of Realtors reported that existing home sales jumped to the highest level since December 2006, up 2.4% from 5.86 million units in July to 6.00 million units in August. More importantly, the housing market continues to be a bright spot, having more than completely recovered after dropping to 3.91 million units in May, the slowest pace since October 2010. Every region of the country saw increases in existing home sales, with historically low mortgage rates helping to buoy increased sales.
In August, single-family and condominium and co-op sales increased 1.7% and 8.6%, respectively. Over the past 12 months, existing home sales have risen 10.5%, up from 5.43 million units in August 2019. Single-family sales rose 11.0% year-over-year, with condo/co-op sales up 6.8% from the pace one year ago.
With the pickup in activity, inventories narrowed to the lowest point since February, down from 3.1 months of supply in July to 3.0 months in August. The median sales price for existing homes has increased 11.4% year-over-year, up to $310,600 in August.
- IHS Markit Flash U.S. Manufacturing PMI: The manufacturing sector in the United States continued to show signs of recovery in September. It notched the best reading since January 2019, bouncing back from springtime declines that were the worst since the Great Recession. The headline index increased from 53.1 in August to 53.5 in September, buoyed by higher output, which expanded at the fastest pace since November 2019. New orders, exports and employment slowed somewhat but continued to grow, and manufacturers remained cautiously upbeat about continued increases in production, albeit with some easing in September’s survey.
The IHS Markit Flash Eurozone Manufacturing PMI rose from 51.7 in August to 53.7 in September, expanding for the third straight month and the best reading since August 2018, as the manufacturing sector continues to rebound from sharp COVID-19-related declines in the spring. In September, new orders, exports and output grew at the fastest rates since February 2018, and employment continued to stabilize despite shrinking for the 15th consecutive month. The index for future output rose to a pace not seen since April 2018, highlighting optimism about production growth over the coming six months. German manufacturers reported the strongest manufacturing growth in 26 months, and in France, activity rebounded in September after contracting in August.
With that said, overall business activity in Europe slowed to a near halt in September, with the Flash Eurozone PMI Composite Output Index dropping from 51.9 to 50.1 on renewed contractions in the service sector.
Outside the European Union, the United Kingdom’s manufacturing sector pulled back in September from August’s pace, which had been the best since February 2018, but continued to expand modestly. Respondents continued to feel optimistic in their outlook. Yet, the services sector had more pronounced slowing in September, and new restrictions might complicate sentiment in the forthcoming October survey.
- Kansas City Fed Manufacturing Survey: Manufacturing activity expanded for the fourth straight month, but the pace of growth slowed, with the composite index of general business conditions dipping from 14 in August to 11 in September. Growth eased for new orders, shipments, production and employment in September, and the average employee workweek and exports contracted slightly. Prices for raw materials accelerated, increasing at the fastest pace since January. Some respondents cited a weakened sales environment, while others continued to cite difficulties in finding enough talent.
Moving forward, respondents continued to feel cautiously positive about additional growth over the next six months, with increased growth rates for new orders, production, shipments and the average employee workweek. Respondents predicted employment and capital spending to rise, but with some easing from expectations in the previous report. For the first time since February, respondents anticipated exports to rise over the months ahead.
- New Home Sales: New single-family home sales rose 4.8% from 965,000 units in July to 1,011,000 units in August, the best reading since September 2006. Historically low mortgage rates have helped buoy the housing market, which has bounced back strongly after new home sales plummeted to 570,000 units sold in April. Over the past 12 months, new single-family home sales have jumped 43.2%, up from 706,000 units in August 2019 and with robust gains across the country. Nonetheless, the August new home sales data provided mixed results regionally, up in the Northeast and South but lower in the Midwest and West.
Inventories of new homes for sale have narrowed significantly, declining from 3.6 months of supply in July to 3.3 months in August, a new record low for a data series that dates to 1963. Yet, the median sales price fell for the month, down from $327,000 in July to $312,800 in August.
- Richmond Fed Manufacturing Survey: Manufacturing activity in the Richmond Federal Reserve Bank’s district expanded at the fastest pace in two years, with the sector continuing to bounce back from the lowest reading in the survey’s history in April. The composite index of general business activity increased from 18 in August to 21 in September, rising for the third straight month. New orders, capacity utilization, employment, the average workweek and capital spending accelerated in September, but shipments and inventories slowed. The forward-looking indicators remained encouraging, suggesting that manufacturers in the region expect continued growth in activity over the next six months.
Raw material costs increased from 1.62% at the annual rate in August to 1.91% in September, the strongest pace since February. In addition, respondents anticipate an annualized 2.16% increase in costs six months from now, up from 1.91% in the prior survey.
- Weekly Initial Unemployment Claims: Initial unemployment claims totaled 870,000 for the week ending Sept. 19, edging up from 866,000 for the week ending Sept. 12. Initial claims have decelerated since peaking at 6,867,000 for the week ending March 28, averaging nearly 973,750 over the past eight weeks. However, they remain highly elevated, illustrating continuing pain in the labor market. To put the current numbers in perspective, initial claims peaked during the Great Recession at 665,000 for the week ending March 28, 2009.
Meanwhile, continuing claims declined from 12,747,000 for the week ending Sept. 5 to 12,580,000 for the week ending Sept. 12. This was consistent with 8.6% of the workforce, inching down from 8.7% in the previous report. These data have also eased notably since peaking at 24,912,000 for the week ending May 9, even as it remains clear that too many Americans remain unemployed in the U.S. economy overall.
Along those lines, there were 26,044,952 Americans receiving some form of unemployment insurance benefit for the week ending Sept. 5, down from 29,768,465 for the week ending Aug. 29.
|
|
Thank you for subscribing to the NAM’s Monday Economic Report.
If you’re part of an NAM member company and not yet subscribed, email us. If you’re not an NAM member, become one today!
|
|
|
|
|
|
|
|
|
|
|

