 |
| If you’re having trouble reading this, click here. |
|
| MONDAY ECONOMIC REPORT |
|
|
|
|
| Essential Takes on Leading Economic Indicators |
|
By Chad Moutray, Ph.D., CBE – October 5, 2020– SHARE


|
|
<
|
|
|
| Up and Down Data: Personal Spending Rises, Even as Income Falls |
|
| The Weekly Toplines |
|
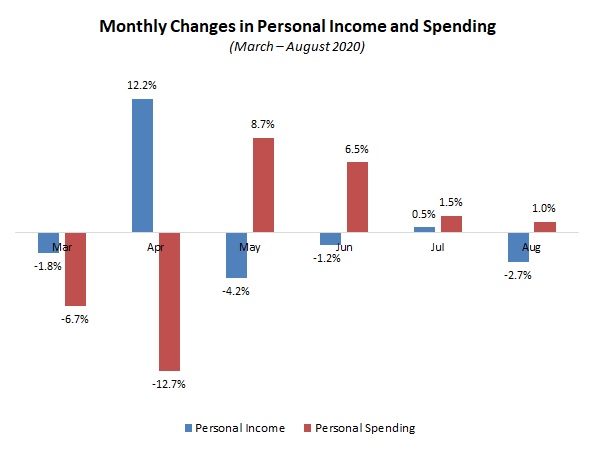
- Personal consumption expenditures rose 1.0% in August, increasing (but slowing) for the fourth straight month. The saving rate fell to 14.1% but remained well above the 7.5% average in 2019, suggesting that consumers remain cautious in their spending despite progress in the economy.
- Meanwhile, personal income decreased 2.7% in August, the biggest monthly decline since May. The data reflect declining transfer payments, with unemployment insurance falling from $1.32 trillion in July to $633.5 billion in August. Total wages and salaries rose 1.3% in August.
- Consumer confidence rose in September to six-month highs in surveys from the Conference Board and the University of Michigan and Thomson Reuters, with improvements in the labor market and household finances. This was especially true for Americans with higher incomes.
- Manufacturers added 66,000 workers in September, rising for the fifth straight month but with employment still down by 647,000 since February. Nonfarm payrolls rose by 661,000 in September, somewhat below consensus estimates despite increasing for the fifth consecutive month.
- The overall labor market data provided mixed results. On the one hand, the unemployment rate dropped to 7.9% in September, continuing the recovery seen since April’s 14.7% reading. Yet, the percentage of the unemployed suggesting that they lost their job permanently rose from 3,411,000 in August to 3,756,000 in September, the highest since May 2013.
- After expanding at the fastest pace since November 2018 in August, the ISM® Manufacturing Purchasing Managers’ Index® slowed somewhat in September, down from 56.0 to 55.4. New orders and production expanded solidly despite some easing, but employment remained negative and raw material prices accelerated.
- The Dallas Federal Reserve Bank reported that manufacturing activity in its district expanded in September at the fastest pace since November 2018, mirroring other regional surveys.
- New factory orders rose 0.7% in August, but sales of manufactured goods have fallen 5.4% over the past 12 months. More encouragingly, new orders for core capital goods—a proxy for capital spending in the U.S. economy—increased 1.9% in August, with 3.0% growth year-over-year.
- Private manufacturing construction spending rose 2.2% to $76.59 billion in August. Nonetheless, construction in the sector has decreased 4.6% from $80.30 billion in August 2019.
- In advance statistics, the goods trade deficit rose to $82.94 billion in August, an all-time high. In August, the increase in goods imports outpaced the rise in goods exports, pushing the goods trade deficit higher. Each has bounced back following steep declines in the spring due to the COVID-19 pandemic and global recession, with goods exports and imports rising to the best reading since March and January, respectively. Final data will be released on Oct. 6.
|
 |
|
| Economic Indicators |
|
Last Week’s Indicators:
(Summaries Appear Below)
Monday, September 28
Dallas Fed Manufacturing Survey
Tuesday, September 29
Conference Board Consumer Confidence
International Trade in Goods (Preliminary)
Wednesday, September 30
ADP National Employment Report
Gross Domestic Product (Second Revision)
Real GDP by Industry
Thursday, October 1
Construction Spending
ISM® Manufacturing Purchasing Managers’ Index®
Personal Consumption Expenditures Deflator
Personal Income and Spending
Weekly Initial Unemployment Claims
Friday, October 2
BLS National Employment Report
Factory Orders and Shipments
University of Michigan Consumer Sentiment (Revision) |
|
|
|
This Week's Indicators:
Monday, October 5
None
Tuesday, October 6
International Trade Report
Job Openings and Labor Turnover Survey
Wednesday, October 7
Consumer Credit
Thursday, October 8
Weekly Initial Unemployment Claims
Friday, October 9
None |
|
|
| Deeper Dive |
|
- ADP National Employment Report: Manufacturing employment jumped by 130,000 in September, increasing for the fifth straight month, according to ADP estimates. Despite recent job growth, the sector has lost 595,060 workers since February, with manufacturers still trying to recover from severe declines in activity due to the COVID-19 pandemic and global recession. Employment in the sector should continue over the coming months, adding another 300,000 workers by year’s end.
Overall, there were 749,000 additional nonfarm private business employees in September, building on the 481,000 gain in August. Like the manufacturing numbers, the labor market has bounced back since dropping sharply in the spring, but there were 10,439,339 fewer workers in September than in February.
In September, in addition to manufacturing, the largest job growth occurred in construction; health care and social assistance; leisure and hospitality; other services; professional and business services; and trade, transportation and utilities. The only major sector with declining employment was education, which lost 11,000 workers in September. Meanwhile, 60.2% of the net job gains in September came from small and medium-sized establishments (i.e., those with fewer than 500 employees).
- BLS National Employment Report: Manufacturers added 66,000 workers in September, rising for the fifth straight month. Despite recent gains, the labor market for the sector remains well below its pre-COVID-19 pace, with manufacturing employment down by 647,000 in September relative to the level in February. There are 12,205,000 workers in the manufacturing sector in September, down from 12,852,000 in February but a definite improvement from 11,489,000 employees in April. As such, sizable challenges in the economic environment continue despite movement in the right direction.
In September, durable and nondurable goods employment rose by 46,000 and 20,000, respectively. The largest gains occurred in transportation equipment (up 15,300, including 14,300 from motor vehicles and parts), machinery (up 13,800), nonmetallic mineral products (up 6,200) and food manufacturing (up 5,000). At the other end of the spectrum, primary metals (down 3,400), chemicals (down 2,000), furniture and related products (down 300) and petroleum and coal products (down 200) each had reduced employment in September.
All of the 19 major sectors continued to experience reduced employment in September relative to February. The following sectors have the largest decreases over that seven-month period: transportation equipment (down 117,800, with motor vehicles and parts down 74,600), fabricated metal products (down 93,400), machinery (down 59,200), printing and related support services (down 52,300), food manufacturing (down 43,100) and primary metals (down 37,100).
Meanwhile, the U.S. economy added 661,000 workers in September, slowing from the gain of 1,489,000 in August but expanding for the fifth straight month. The unemployment rate dropped from 8.4% in August to 7.9% in September, with the number of unemployed workers falling from 13,550,000 to 12,580,000. In addition, the so-called “real unemployment rate”—a term that refers to those marginally attached to the workforce, including discouraged workers and the underemployed—declined from 14.2% to 12.8%. The participation rate in the labor force decreased from 61.7% to 61.4%.
With that said, the percentage of the unemployed suggesting that they lost their job permanently rose from 3,411,000 in August to 3,756,000 in September, the highest since May 2013. This is yet another sign that the labor market remains highly challenged and elevated, even as the unemployment rate improved to the best reading since February.
- Conference Board Consumer Confidence: According to the Conference Board, consumer confidence jumped from 86.3 in August to 101.8 in September, the best reading since March. After experiencing declining sentiment in July and August, Americans felt more upbeat in their assessments of both current and future economic conditions, buoyed by improvements in the labor market and household finances. Along those lines, the percentage of respondents suggesting that business conditions were “good” rose from 16.0% to 18.3%, while the percentage feeling that conditions were “bad” decreased from 43.3% to 37.4%.
Regarding the labor market, the percentage of respondents feeling jobs were “plentiful” increased from 21.4% to 22.9%. At the same time, those saying jobs were “hard to get” declined from 23.6% to 20.0%. In terms of the jobs outlook, the percentage of respondents expecting more jobs in the next six months rose from 29.9% to 33.1%, while those predicting fewer jobs dropped from 21.2% to 15.6%.
- Construction Spending: Private manufacturing construction spending rose 2.2% from $74.95 billion in July to $76.59 billion in August. On a year-over-year basis, private construction spending among manufacturers has decreased 4.6% from $80.30 billion in August 2019. Total private nonresidential spending declined 0.3% in August and 4.3% over the past 12 months, with manufacturing being one of the few exceptions to data that were largely negative for the month in most other categories.
Overall, total private construction spending increased 1.9% in August, rising for the third straight month, with 1.5% growth year-over-year. The data were buoyed by strength in the private residential construction market, which rose 3.7% in August. Single-family housing construction jumped 5.5% for the month, but multifamily activity edged down 0.1%. Over the past 12 months, private residential construction rose 6.7%, with single-family and multifamily construction up 2.9% and 8.9% year-over-year, respectively. Meanwhile, public construction spending inched up 0.1% in August, with 5.5% growth from one year earlier.
- Dallas Fed Manufacturing Survey: The Dallas Federal Reserve reported that manufacturing activity expanded at the fastest pace since November 2018, with the composite index of general business activity rising from 8.0 in August to 13.6 in September. The sector continues to rebound from very sharp declines in the spring, with new orders, production and capacity utilization rising at the best readings in roughly two years. Hiring increased for the third straight month, with the index for employment improving to a one-year high. At the same time, raw material costs accelerated at the highest rate since December 2018. Shipments eased slightly, but growth remained solid. Capital spending, which was neutral in August, increased modestly in September.
Encouragingly, manufacturers in the district felt optimistic in their outlook for the next six months, with the forward-looking composite index of business conditions improving from 20.4 in August to 28.0 in September, the best reading since October 2018.
- Factory Orders and Shipments: New orders for manufactured goods rose 0.7% in August, slowing notably (but still increasing) from the 6.5% gain in July. Durable and nondurable goods sales rose 0.5% and 0.8% in August, respectively. The manufacturing sector continues to recover from severe COVID-19 disruptions in March and April, but the overall pace of new orders remains well below the pre-pandemic pace. On a year-over-year basis, new orders in the manufacturing sector have fallen 5.4% since August 2019. With transportation equipment excluded, factory sales have fallen 3.8% year-over-year.
Encouragingly, new orders for core capital goods (or nondefense capital goods excluding aircraft)—a proxy for capital spending in the U.S. economy—rose 1.9% in August. More importantly, core capital goods orders have risen 3.0% over the past 12 months.
Meanwhile, factory shipments increased 0.3% in August, and with transportation equipment excluded, shipments rose 0.7%. Nondurable goods shipments increased 0.8% in August, but shipments of durable goods fell 0.2%. Since August 2019, manufactured goods shipments have decreased 3.9%. At the same time, core capital goods shipments have risen 1.3% year-over-year.
- Gross Domestic Product (Second Revision): The U.S. economy contracted 31.4% at the annual rate in the second quarter, the largest decline in the history of the series, which dates to 1947. With the nation grappling with the COVID-19 pandemic, economic activity was curtailed severely under stay-at-home orders, business closures and unprecedented operational disruptions for manufacturers and other firms. Moving forward, real GDP should rise 26% at the annual rate in the third quarter as economic activity resumes, albeit with lingering reluctance for many participants, at least until there is more certainty regarding COVID-19 and its spread. The outlook is for economic growth to shrink 3.3% in 2020, expanding 3.0% in 2021.
Breaking down the details in this report:
- Personal consumption expenditures fell an annualized 33.2% in the second quarter, extending the 6.9% decline in the first quarter and contributing to 24.01% of the drop in headline real GDP. The bulk of this decline stemmed from service-sector spending, reflecting the extent of business closures. Durable goods spending fell 12.5% and 1.7% in the first and second quarters, respectively, with nondurable goods spending off 15.0% in the second quarter.
- Business investment fell a whopping 46.6% at the annual rate, with nonresidential and residential investment down 27.2% and 35.6%, respectively. Activity declined sharply across the board, with gross private domestic investment subtracting 8.77% from headline growth. This included private inventories, which have declined for five straight quarters and shrunk real GDP by 3.50% in the second quarter, as firms have reduced their spending on stockpiles.
- Net exports added 0.62% to top-line growth in the second quarter, contributing positively to real GDP for four consecutive quarters. However, that masks the true story, which reflects a massive decline in trade volumes in the quarter. Goods exports and imports plummeted 66.8% and 49.6% at annual rates in the second quarter, respectively.
- Government spending provided mixed results. Federal government spending rose an annualized 16.4% in the second quarter, reflecting the uptick in transfer payments and adding 1.17% to real GDP growth. It was a rare bright spot. In contrast, state and local government spending dropped 5.4% at the annual rate, subtracting 0.40% from top-line growth.
- International Trade in Goods (Preliminary): In advance statistics, the goods trade deficit rose from $80.11 billion in July to $82.94 billion in August, an all-time high. In August, the increase in goods imports (up from $195.29 billion to $201.29 billion) outpaced the rise in goods exports (up from $115.18 billion to $118.35 billion), pushing the goods trade deficit higher. Each has bounced back following steep declines in the spring due to the COVID-19 pandemic and global recession, with goods exports and imports rising to the best reading since March and January, respectively.
Strength in foods, feeds and beverages and industrial supplies led the increase in goods exports in August. At the same time, goods imports rose across the board for the month, except for industrial supplies. Final data will be released Oct. 6, which will also include the service-sector trade surplus.
- ISM® Manufacturing Purchasing Managers’ Index®: After expanding at the fastest pace since November 2018 in August, the Institute for Supply Management® reported that growth in manufacturing activity slowed somewhat in September. The sample comments note rebounds in the manufacturing sector, but also lingering demand and supply disruptions and uncertainties in the outlook. The headline index declined from 56.0 in August to 55.4 in September. New orders (down from 67.6 to 60.2) and production (down from 63.3 to 61.0) continued to expand at solid rates despite pulling back from more robust readings in the previous survey. In addition, the backlog of orders (up from 54.6 to 55.2), exports (up from 53.3 to 54.3) and supplier deliveries (up from 58.2 to 59.0) each accelerated in September, with exports notching the best reading since September 2018.
Discouragingly, employment (up from 46.4 to 49.6) contracted for the 14th straight month, yet hiring stabilized to near neutral in September. Nearly 59% of respondents said that employment at their firm did not change for the month. Moreover, raw material prices (up from 59.5 to 62.8) have continued to strengthen, with input prices rising for the fourth straight month following deflationary pressures in the spring. Meanwhile, inventories (up from 44.4 to 47.1) declined for the third consecutive month. Timothy Fiore, chair of the ISM® Manufacturing Business Survey Committee, attributed the decreases to continuing supplier difficulties despite the pickup in overall production.
- Personal Consumption Expenditures Deflator: The PCE deflator increased 0.3% in August, slowing from the gain of 0.4% in July but rising for the fourth straight month. After experiencing sharp deflationary pressures in March and April at the beginning of the COVID-19 pandemic, the latest data suggest that costs have stabilized since then. Overall, the PCE deflator has risen 1.4% year-over-year, and core inflation, which excludes food and energy costs, has increased 1.6% over the past 12 months. Energy prices rose 0.8% in August, but food costs edged down 0.1%. On a year-over-year basis, energy prices have fallen 9.4%, with food prices up 4.3%.
Despite higher costs in the past three months, the core PCE deflator has remained below 2% for 20 straight months. More than anything, the Federal Reserve remains more worried about economic growth than inflation, as seen in the extraordinary measures taken over the past few months to help prop up the economy and to address credit and liquidity concerns in financial markets.
- Personal Income and Spending: Personal consumption expenditures rose 1.0% in August, increasing for the fourth straight month, with Americans continuing to spend modestly after pulling back dramatically in their purchasing in the spring due to COVID-19. Durable goods spending increased 0.9% in August but purchases of nondurable goods edged down 0.1%.
The saving rate, which had soared to an all-time high of 33.6% in April, declined for the fourth consecutive month to 14.1% in August. However, that remains highly elevated, well above the 7.5% average in 2019, suggesting that consumers remain cautious in their spending despite progress in the economy since the depths of the pandemic. Over the past 12 months, personal spending has fallen 1.9% since August 2019, which was an improvement from the decline of 16.3% year-over-year in April. Consumers spent 5.4% less on services in August than one year earlier, but encouragingly, durable and nondurable goods spending rose 12.1% and 2.6% year-over-year, respectively.
Meanwhile, personal income decreased 2.7% in August, the biggest monthly decline since May. These data have been heavily influenced by transfer payments over the past few months. Unemployment insurance has soared from $27.8 billion in February to $1.40 trillion in June, but it has declined since then to $1.32 trillion in July and $633.5 billion in August. In addition, government assistance checks were largely responsible for the 12.2% increase in personal income in April. Overall, personal income has risen 4.7% since August 2019.
In August, wages and salaries and proprietors’ income rose 1.3% and 2.7%, respectively, but these figures fell 0.5% and 1.4% year-over-year. Manufacturing wages and salaries rose from $870.7 billion in July to $883.9 billion in August, down 2.2% from $903.6 billion one year earlier.
- Real GDP by Industry: The U.S. economy shrank 31.4% at the annual rate in the second quarter, as described above. Starting with this release, breakouts by industry are now included in the second revision report on GDP.
According to the Bureau of Economic Analysis, real value-added output in the manufacturing sector plummeted by an annualized 36.6% from $2.200 trillion in the first quarter to $1.963 trillion in the second quarter, as expressed in chained 2012 dollars. This extends the 6.4% decline in the first quarter, pulling back from the all-time high for real value-added output in the sector in the fourth quarter of 2019, which registered $2.236 trillion. In the latest data, real value-added output for durable goods dropped from $1.223 trillion to $1.061 trillion, with nondurable goods activity down from $976.4 billion to $902.5 billion.
Overall, manufacturing subtracted 4.10 percentage points from real GDP in the second quarter. Manufacturing accounted for 10.5% of real GDP in the second quarter, down from 10.9% in the first quarter.
Digging into the data, manufacturing value-added output reached an all-time high in the fourth quarter of 2019 ($2.370 trillion), but it has pulled back sharply since then, dropping to $2.346 trillion and $2.054 trillion in the first and second quarters, respectively. Similarly, manufacturing gross output decreased from $6.210 trillion in the fourth quarter, to $6.116 trillion in the first quarter, to $5.333 trillion in the second quarter.
- University of Michigan Consumer Sentiment (Revision): Consumer confidence rose to a six-month high, up from 74.1 in August to 80.4 in September, according to the University of Michigan and Thomson Reuters. That was an improvement to the previous estimate of 78.9, and Americans felt more upbeat in their assessments of both current conditions and future expectations. Still, consumer confidence remains well below the levels seen before the COVID-19 outbreak. The headline index reached a nearly two-year high in February at 101.0, before plummeting to 71.8 in April, the lowest level since December 2011.
In addition, recent gains in consumer confidence have been driven mostly by those with higher incomes, with Americans earning less continuing to cite weaknesses in the broader economy.
- Weekly Initial Unemployment Claims: Initial unemployment claims totaled 837,000 for the week ending Sept. 26, down from 873,000 for the week ending Sept. 19. Initial claims have decelerated since peaking at 6,867,000 for the week ending March 28, averaging 958,889 in August and September. However, they remain highly elevated, illustrating continuing pain in the labor market. To put the current numbers in perspective, initial claims peaked during the Great Recession at 665,000 for the week ending March 28, 2009.
Meanwhile, continuing claims declined from 12,747,000 for the week ending Sept. 12 to 11,767,000 for the week ending Sept. 19. This was consistent with 8.1% of the workforce, down from 8.7% in the previous report. These data have also eased notably since peaking at 24,912,000 for the week ending May 9, even as it remains clear that too many Americans remain unemployed in the U.S. economy overall.
Along those lines, 26,529,810 Americans received some form of unemployment insurance benefit for the week ending Sept. 12, up from 26,044,954 for the week ending Sept. 5.
|
|
|
Thank you for subscribing to the NAM’s Monday Economic Report.
If you’re part of an NAM member company and not yet subscribed, email us. If you’re not an NAM member, become one today!
|
|
|
|
|
|
|
|
|
|
|

