 |
| If you’re having trouble reading this, click here. |
|
| MONDAY ECONOMIC REPORT |
|
|
|
|
| Essential Takes on Leading Economic Indicators |
|
By Chad Moutray, Ph.D., CBE – January 18, 2021 – SHARE


|
|
<
|
|
|
| Manufacturing Production Expected to Reach Pre-Pandemic Levels by Year's End |
|
| The Weekly Toplines |
|
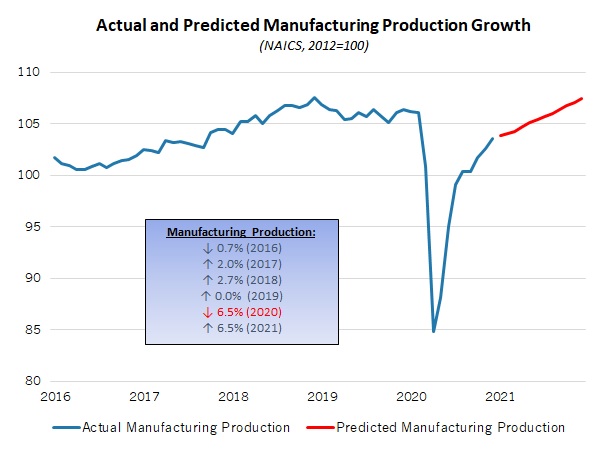
- Manufacturing production increased 0.9% in December, rising for the eighth straight month. Despite gains since the spring, manufacturing production remained 2.6% below the pre-pandemic pace in February. Overall, manufacturing production fell 6.5% on average in 2020, but output should rise by the same percentage in 2021.
- Even as capacity remained 2.3% below what was seen in February, manufacturing capacity utilization increased from 72.7% in November to 73.4% in December, the highest rate since the COVID-19 pandemic began.
- In January, manufacturing activity expanded in the New York Federal Reserve Bank’s district for the seventh consecutive month, albeit at the slowest pace since June. Business leaders were upbeat in their outlook. Yet, input costs accelerated at the fastest rate since September 2018.
- Manufacturing job openings remained strong, despite pulling back from October’s all-time high, with 498,000 postings in the sector in November. In general, the U.S. had 1.64 unemployed workers for every one job opening.
- The labor market has softened since October, especially in the service sector, as seen in the most recent jobs data for December. Along those lines, initial unemployment claims jumped for the week ending Jan. 9 to the highest level since the week ending Aug. 22. The pace of first-time claims accelerated sharply, with rising COVID-19 claims and increased pandemic benefits because of new legislation passed at year’s end.
- Consumer spending at retailers fell 0.7% in December, with Americans reducing their purchasing for the third straight month. This weakness reflects caution on the part of consumers, but also lingering uncertainties related to the continued spread of COVID-19. Despite ending the year on a weak note, retail sales have risen by a modest 2.9% over the past 12 months.
- Consumer sentiment declined from 80.7 in December to 79.2 in January, according to preliminary data from the University of Michigan and Thomson Reuters.
- The National Federation of Independent Business reported that the Small Business Optimism Index dropped from 101.4 in November to 95.9 in December, its lowest level since May, with small business owners expressing anxiety about the economy and the political landscape. Taxes and workforce concerns topped the “single most important problem” list in December.
- Increased energy costs helped push the consumer and producer price indices higher in December. However, the year-over-year pace of growth for both suggests that overall inflationary pressures remain largely in check, at least for now.
|
 |
|
| Economic Indicators |
|
Last Week's Indicators:
(Summaries Appear Below)
Monday, January 11
None
Tuesday, January 12
Job Openings and Labor Turnover Survey
NFIB Small Business Survey
Wednesday, January 13
Consumer Price Index
Thursday, January 14
Weekly Initial Unemployment Claims
Friday, January 15
Industrial Production
New York Fed Manufacturing Survey
Producer Price Index
Retail Sales
University of Michigan Consumer Sentiment |
|
|
|
This Week's Indicators:
Monday, January 18
None
Tuesday, January 19
None
Wednesday, January 20
NAHB Housing Market Index
Thursday, January 21
Housing Starts and Permits
Philadelphia Fed Manufacturing Survey
Weekly Initial Unemployment Claims
Friday, January 22
IHS Markit Flash U.S. Manufacturing PMI |
|
|
| Deeper Dive |
|
- Consumer Price Index: Consumer prices rose 0.4% in December, extending the 0.2% gain seen in November and increasing at the fastest monthly rate since August. Higher gasoline prices, which rose 8.4% in December, helped lift energy costs, which rose 4.0% for the month. Food prices increased 0.4% in December, mirroring the headline number. Overall, energy prices remain 7.0% lower than one year ago, with gasoline prices down 15.2% year-over-year. At the same time, the cost of food has risen 3.9% over the past 12 months.
Excluding food and energy, consumer prices edged up 0.1% in December. Prices for apparel, new vehicles and shelter all increased in the latest data. In contrast, costs for household furnishings and supplies, medical care commodities and services, transportation services and used cars and trucks fell in December.
Over the past 12 months, the consumer price index has risen 1.3% (seasonally adjusted), up from 1.2% in the previous release. Meanwhile, core inflation (which excludes food and energy) has risen by a seasonally adjusted 1.6% since December, down from 1.7% year-over-year in November. Consumer prices have stabilized in recent months, with inflationary pressures largely in check for now.
- Industrial Production: Manufacturing production increased 0.9% in December, rising for the eighth straight month. Durable and nondurable goods production rose 1.0% and 0.9% for the month, respectively. Despite gains since the spring, manufacturing production remained 2.6% below the pre-pandemic pace in February. Output in the sector continued to rebound following the 20.0% decline between February and April due to the COVID-19 pandemic.
Even as capacity remained 2.3% below what was seen in February, manufacturing capacity utilization increased from 72.7% in November to 73.4% in December, the highest rate since the COVID-19 pandemic began.
In December, the largest increases in manufacturing production occurred in nonmetallic mineral products (up 3.3%), plastics and rubber products (up 3.2%), aerospace and miscellaneous transportation equipment (up 2.5%), primary metals (up 2.5%), wood products (up 2.3%), furniture and related products (up 2.1%) and machinery (up 2.1%). In contrast, three sectors had reduced output for the month: motor vehicles and parts (down 1.6%), printing and related products (down 1.4%) and computer and electronic products (down 0.6%). Food, beverage and tobacco products production was flat in December.
On a year-over-year basis, four of the major manufacturing sectors experienced increased production over the past 12 months: motor vehicles and parts (up 3.6%), food, beverage and tobacco (up 0.4%), wood products (up 0.4%) and computer and electronic products (up 0.1%). The biggest year-over-year declines occurred in petroleum and coal products (down 13.3%), printing and related support activities (down 10.4%), furniture and related products (down 9.9%), aerospace and miscellaneous transportation equipment (down 8.3%) and primary metals (down 7.7%).
Meanwhile, total industrial production rose 1.6% in December, its strongest monthly increase since July and expanding for the third consecutive month. In December, mining and utilities production rose 1.6% and 6.2%, respectively. Over the past 12 months, industrial production has dropped 3.6%, with mining production down 12.3% year-over-year. However, utilities output has increased 2.7% since December 2019. Total capacity utilization increased from 73.4% in November to 74.5% in December, a 10-month high but still down 3.1% since February.
- Job Openings and Labor Turnover Survey: November saw 498,000 manufacturing job openings, pulling back from 531,000 in October, which was an all-time high. Nondurable goods manufacturers reported a record number of job postings in November, up from 236,000 to 250,000. However, openings among durable goods firms dropped sharply, down from 296,000 to 248,000. Despite softening in the latest data, manufacturing job openings have firmed up in recent months from springtime weaknesses.
In the larger economy, nonfarm business job openings decreased from 6,632,000 in October to 6,527,000 in November. Overall, 10,728,000 Americans were unemployed in November, down from 11,049,000 in October. The November figure translates into 1.64 unemployed workers for every one job opening, down from 1.93 in September and 1.67 in October. For comparison, the April figure translated into 4.63 unemployed workers for every one job opening, up from just 0.82 in February. (In December jobs data, the unemployment level inched up to 10,736,000.)
In November, manufacturers hired 397,000 workers, up from 376,000 in October and a five-month high. Hiring was stronger for both durable and nondurable goods industries, but particularly for the latter. At the same time, total separations declined from 350,000 to 340,000, a three-month low. Net hiring (or hiring minus separations) was 57,000 in November, up from 26,000 in October.
Nonfarm business layoffs have accelerated, up from the all-time low in September (1,437,000) to 1,676,000 in October to 1,971,000 in November, the highest since June (1,995,000). The increases were primarily in the service sector due to new restrictions from rising COVID-19 cases. Meanwhile, layoffs in the manufacturing sector have been relatively stable, down from 111,000 in October to 103,000 in November, remaining well below the 635,000 layoffs seen in April.
- New York Fed Manufacturing Survey: In January, manufacturing activity expanded in the New York Federal Reserve Bank’s district for the seventh consecutive month, albeit at the slowest pace since June. The composite index of general business activity declined from 4.9 in December to 3.5 in January, with slower growth in shipments and employment. At the same time, new orders and the average workweek expanded faster, with inventories stabilizing somewhat, despite contracting for 10 straight months. Input costs accelerated at the fastest rate since September 2018.
Meanwhile, manufacturers in the Empire State Manufacturing Survey remain upbeat about stronger activity over the next six months, despite the forward-looking composite index dipping from 36.3 in December to 31.9 in January. Nearly half of respondents expect new orders and shipments to expand moving forward, with roughly 31% anticipating more employment and capital spending. Respondents also anticipate that raw material prices will continue to grow strongly, with the index for expected prices paid inching up to its highest level since December 2018.
- NFIB Small Business Survey: The National Federation of Independent Business reported that the Small Business Optimism Index dropped from 101.4 in November to 95.9 in December, its lowest level since May, with small business owners expressing anxiety about the economy and the political landscape. In 2020, the headline index averaged 99.6, down from 103.0 in 2019 and the weakest annual average in four years. Traditionally, index readings above 100 are consistent with a healthy and growing small business sector.
The net percentage of respondents feeling that business conditions will get better over the next six months fell from 8% to -16%, the first negative reading since October 2016. Many of the key components of the survey were lower in December, including the percentage of respondents saying that the next three months would be a “good time to expand” (down from 12% to 8%) and the net percentage expecting greater sales over the next three months (down from 10% to -4%).
Meanwhile, the labor market data were mixed. Hiring remained negative on net for the ninth straight month, even as employment has stabilized since the spring. Yet, small business employment softened in December. The percentage of respondents planning to increase hiring over the next three months slipped from 21% to 17%, and the percentage suggesting they had job openings they were unable to fill edged down from 34% to 32%. Respondents once again cited difficulties in obtaining enough labor as the top “single most important problem.” However, this month, it was tied with taxes—a reaction likely due to the election outcome.
Regarding capital spending, 52% of small firms have made an investment over the past six months, inching down from 53% over the prior three months. In addition, the percentage of respondents planning to make a capital investment over the next three to six months declined from 26% to 22%.
- Producer Price Index: Producer prices for final demand goods and services increased by 0.3% in December, rising for the eighth straight month. At the same time, producer prices for final demand goods increased 1.1% in December, the fastest pace since May. Energy prices jumped 5.5% in December, the strongest rate since June, but food costs edged down 0.1% for the month. Despite tremendous volatility this year due to the COVID-19 pandemic, the cost of food has risen a very modest 1.3% over the past 12 months. In contrast, energy costs have fallen 7.4% year-over-year. Core inflation for raw material goods, which excludes food and energy, increased 0.5% in December, a robust pace that was the strongest monthly pace since January 2014. Producer prices for final demand services edged down 0.1% in December.
Over the past 12 months, producer prices for final demand goods and services have increased 0.8%, the same year-over-year rate as in November. At the same time, core producer prices have risen 1.1% since December 2019, up from 0.9% year-over-year in November.
The bottom line is that inflation remains largely in check for raw material costs, despite accelerating producer prices in recent months. Core inflation has remained below 2% for 18 straight months. For its part, the Federal Reserve has pursued extraordinary monetary policy measures to help prop up the economy, with little worry about inflation. It remains committed to its stimulative stance for the foreseeable future.
- Retail Sales: Consumer spending at retailers fell 0.7% in December, with Americans reducing their purchasing for the third straight month. This weakness reflects caution on the part of consumers, but also lingering uncertainties related to the continued spread of COVID-19. In the latest data, consumers spent less at department stores (down 3.8%), electronics and appliance stores (down 4.9%), food services and drinking places (down 4.5%), grocery stores (down 1.7%) and nonstore retailers (down 5.8%), among others. In contrast, retail sales were higher at building material and garden supply stores (up 0.9%), clothing and accessories stores (up 2.4%) gasoline stations (up 6.6%), health and personal care stores (up 1.1%), miscellaneous store retailers (up 1.7%) and motor vehicles and parts dealers (up 1.9%). Excluding gasoline and motor vehicles, retail spending was down 2.1% in December, also falling for the third consecutive month.
Despite ending the year on a weak note, retail sales have risen by a modest 2.9% over the past 12 months, or 2.6% with motor vehicles and parts and gasoline excluded. The bright spots on a year-over-year basis included nonstore retailers (up 19.2%), building material and garden supply stores (up 17.0%), sporting goods and hobby stores (up 15.2%), motor vehicle and parts dealers (up 10.1%) and food and beverage stores (up 8.9%). At the other end of the spectrum, department stores (down 21.4%), food services and drinking places (down 21.2%), electronics and appliance stores (down 16.6%), clothing and accessory stores (down 16.0%) and gasoline stations (down 12.1%) each experienced retail sales declines over the past 12 months.
- University of Michigan Consumer Sentiment: Consumer confidence declined from 80.7 in December to 79.2 in January, according to preliminary data from the University of Michigan and Thomson Reuters. Americans were less upbeat in their assessment of both current economic conditions and the outlook for the coming months. Wide disparities along partisan lines remained, with Democrats feeling more positive than Republicans post-election. The rise in COVID-19 cases and political challenges served as drags on confidence in January, despite optimism surrounding vaccinations and the prospects of normalization at some point later this year. Final data will be released on Jan. 29.
- Weekly Initial Unemployment Claims: Initial unemployment claims totaled 965,000 for the week ending Jan. 9, pulling back slightly from 784,000 claims for the week ending Jan. 2 and the highest since the week ending Aug. 22. As such, the pace of first-time claims accelerated sharply, with rising COVID-19 claims and increased pandemic benefits because of new legislation passed at year’s end. Overall, the data remain elevated, despite significant progress since last spring.
Meanwhile, continuing claims rose from 5,072,000 for the week ending Dec. 26 to 5,271,000 for the week ending Jan. 2, a three-week high and consistent with 3.7% of the workforce. At the same time, 18,406,940 Americans received some form of unemployment insurance benefit (including state and federal programs) for the week ending Dec. 26. This figure represents a decline from 19,151,451 for the week ending Dec. 19, largely on reductions in pandemic assistance.
|
|
| Take Action |
|
- The National Association of Manufacturers is interested in learning more about innovations and value in employer-sponsored health care coverage in the manufacturing sector, working closely with researchers from Northwestern University. This survey also includes questions about COVID-19 testing and vaccines, because we recognize it is a topic of high priority for our members. Please take a few minutes to complete this survey. Please forward to someone in human resources or in benefits management who might be better suited to respond to these questions. The deadline for submissions on this survey is Friday, Jan. 29, at 5:00 p.m. ET. All responses will be kept confidential. Results will be released in 2021 and made available online.
- The Manufacturing Institute and Deloitte request your voice today in a survey on the workforce landscape in manufacturing, particularly as we work to close the opportunity gap in the sector. Please take this short survey to share your thoughts about the recruitment, retention and development of a diverse and inclusive manufacturing workforce. All individual responses will be kept confidential, and the survey results will be published in a report this spring.
|
|
Thank you for subscribing to the NAM’s Monday Economic Report.
If you’re part of an NAM member company and not yet subscribed, email us. If you’re not an NAM member, become one today!
|
|
|
|
|
|
|
|
|
| Interested in becoming a presenter of the Monday Economic Report? Email us. |
|
| Questions or comments? Email NAM Chief Economist Chad Moutray at [email protected]. |
|
| You received this email because you signed up for the NAM’s Monday Economic Report as a part of your NAM membership. |
|
| Manage my email newsletters and alerts | Unsubscribe |
|
 |
|
| © 2021 National Association of Manufacturers |
|
|
|
|
|
|
|
