 |
| If you’re having trouble reading this, click here. |
|
| MONDAY ECONOMIC REPORT |
|
|
|
|
| Essential Takes on Leading Economic Indicators |
|
By Chad Moutray, Ph.D., CBE – April 1, 2019 – SHARE


|
|
<
|
|
|
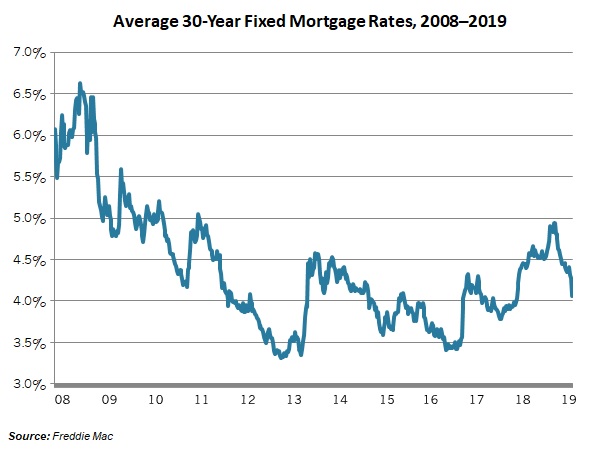
Mortgage Rates Fall to Lowest Level Since January 2018 |
|
| The Weekly Toplines |
|
- The housing market provided mixed news last week, but lower interest rates should give a boost moving forward. On that note, the average 30-year mortgage rate registered 4.06 percent last week, according to Freddie Mac, the lowest level since January 2018. As a reference, rates were 4.94 percent as recently as November.
- Indeed, new home sales rebounded in February, up 4.9 percent to the best reading in 11 months, with reduced mortgage rates likely helping to boost demand.
- Yet, new residential construction disappointed once again, falling 8.7 percent from an annualized 1,273,000 units in January to 1,162,000 units in February. The decline came entirely from a sizable drop in single-family activity, which decreased from 970,000 units to 805,000 units for the month, the slowest pace since May 2017. On the positive side, while housing permits fell to 1,296,000 units at the annual rate in February, they continue to hover around 1.3 million units and provide some degree of encouragement for a rebound.
- The U.S. economy grew 2.2 percent at the annual rate in the fourth quarter in revised data, slipping from the earlier estimate of 2.6 percent. For the year, real GDP rose 2.9 percent in 2018, or 3.1 percent from Q4:2017 to Q4:2018. As such, economic growth last year registered the best reading since 2005, as expected, on a year-over-year basis.
- Moving forward, I predict 2.4 percent growth for 2019, recognizing that the global economy is softening and there are lingering political uncertainties out there.
- As seen in other regional manufacturing data, the Dallas and Richmond Federal Reserve Banks reported continued expansion of activity in March, building off of weaker data at the end of 2018. Respondents remained upbeat about sales, output, shipments, employment and capital spending for the next six months, and firms have seen some moderation in pricing pressures.
- Indeed, the personal consumption expenditures deflator edged down 0.1 percent in January, the first decline since March 2017 and pulled lower by reduced energy costs. Over the past 12 months, this measure has risen just 1.4 percent, the slowest year-over-year pace since September 2016. Core inflation decreased to 1.8 percent year-over-year in January, and the recent deceleration in price growth has likely provided some comfort to the Federal Reserve.
- Personal income rose 0.2 percent in February, with 4.2 percent growth since February 2018. Meanwhile, personal spending inched up 0.1 percent in January after falling in December. (Due to the partial government shutdown, the February personal spending data have been delayed.) Personal consumption expenditures have continued to increase at a steady pace, up 3.7 percent year-over-year, but the saving rate remains elevated.
|
 |
|
| Economic Indicators |
|
Last Week's Indicators:
(Summaries Appear Below)
Monday, March 25
Chicago Fed National Activity Index
Dallas Fed Manufacturing Survey
Tuesday, March 26
Conference Board Consumer Confidence
Housing Starts and Permits
Richmond Fed Manufacturing Survey
Wednesday, March 27
International Trade Report
Thursday, March 28
Gross Domestic Product (Revision)
Kansas City Fed Manufacturing Survey
Friday, March 29
New Home Sales
Personal Consumption Expenditures Deflator
Personal Income and Spending
University of Michigan Consumer Sentiment
|
|
|
|
This Week's Indicators:
Monday, April 1
Construction Spending
ISM® Manufacturing Purchasing Managers’ Index®
Retail Spending
Tuesday, April 2
Durable Goods Orders and Shipments
Wednesday, April 3
ADP National Employment Report
Thursday, April 4
None
Friday, April 5
BLS National Employment Report
|
|
|
| Deeper Dive |
|
- Chicago Fed National Activity Index: The Chicago Federal Reserve Bank reported that the U.S. economy continued to show weaknesses in February, with the National Activity Index in negative territory for the third straight month. The headline index pulled back further in the latest data, down from -0.25 in January to -0.29 in February. Index values above zero are consistent with economic growth that is above trend and vice versa. Production-related indicators were a drag on growth in February, with manufacturing production down 0.4 percent for the month. At the same time, just 20,000 workers were added to nonfarm payrolls in February, and employment-related indicators also subtracted from the NAI for the month.
- Conference Board Consumer Confidence: Consumer sentiment eased in March, continuing to seesaw over the past few months, with the headline index dropping from 131.4 in February to 124.1 in March. While this measure has pulled back since reaching the highest level since September 2000 in October (137.9), Americans continued to be mostly positive overall, particularly when one looks at the longer-term trend. The Conference Board added, “Confidence has been somewhat volatile over the past few months, as consumers have had to weather volatility in the financial markets, a partial government shutdown and a very weak February jobs report.” Despite the pullback in March, the percentage of respondents expecting their income to increase rose from 20.6 percent to 21.0 percent, with those predicting declining income falling from 8.3 percent to 7.6 percent.
- Dallas Fed Manufacturing Survey: Manufacturing activity continued to expand modestly in March. The composite index of general business activity declined from 13.1 in February to 8.3 in March but expanded for the third straight month. The underlying data provided mixed results. Growth in capacity utilization, employment and production picked up slightly for the month, but new orders and shipments slowed a bit. Overall, manufacturers in the Texas district remained optimistic about the next six months, and more than half see increased sales, output and shipments moving forward. In addition, 43.9 percent forecast more hiring, and 39.8 percent anticipate additional capital investments over the coming months. Nearly 55 percent predict increased wages and benefits—illustrating continued tightness in the labor market.
- Gross Domestic Product (Fourth Quarter): The U.S. economy grew 2.2 percent at the annual rate in the fourth quarter in revised data, slipping from the earlier estimate of 2.6 percent. The slight easing in growth for the quarter came from downward revisions to goods consumption, residential construction and state and local government spending, but imports data slightly improved from the prior estimates. For the year, real GDP rose 2.9 percent in 2018, or 3.1 percent from Q4:2017 to Q4:2018. As such, economic growth last year registered the best reading since 2005, as expected, on a year-over-year basis.
In the fourth quarter figures, consumer and business spending continued to be bright spots. Personal consumption expenditures rose a modest 2.5 percent at the annual rate in the fourth quarter, with durable goods spending up 3.6 percent, and nonresidential fixed investment increased a solid 5.4 percent. In 2018, nonresidential fixed investment jumped 6.9 percent, the strongest annual reading since 2012 and likely buoyed by tax reform. On the other hand, there were continuing drags in growth from net exports and residential fixed investment, with state and local government spending also providing a negative contribution in the fourth quarter.
Moving forward, I predict 2.4 percent growth for 2019, recognizing that the global economy is softening and there are lingering political uncertainties out there. With that in mind, policymakers need to build on last year’s momentum by taking action on additional manufacturing priorities, including approval of the U.S.– Mexico–Canada Agreement, to ensure manufacturers in America can continue to grow and prosper.
- Housing Starts and Permits: New residential construction disappointed once again in February after rebounding in January. New housing starts fell 8.7 percent from an annualized 1,273,000 units in January to 1,162,000 units in February. The decline came entirely from a sizable drop in single-family activity, which decreased from 970,000 units to 805,000 units for the month, the slowest pace since May 2017. Given lower mortgage rates, this is perhaps surprising, as it was expected that reduced rates would help improve affordability for homebuyers. In contrast, multifamily starts rose from 303,0000 units to 357,000 units in this report. Overall, this release confirms that the housing market remains challenged, at least for now, with starts down 9.9 percent year-over-year, down from 1,290,000 units in February 2018.
Moving forward, new residential construction is still anticipated to recover. Housing permits—a proxy of future activity—declined from 1,317,000 units at the annual rate in January to 1,296,000 units in February, but it remains encouraging that permits continue to hover around 1.3 million units. Single-family permitting was unchanged at 821,000 units in February, with multifamily activity down from 496,000 units to 475,000 units. For their part, builders feel upbeat about sales over the next six months, largely on expectations that construction activity will rebound.
- International Trade Report: The U.S. trade deficit continued to be highly volatile, dropping from a 10-year high of $59.90 billion in December to $51.15 billion in January. The decline in the latest figures came largely from a sizable drop in goods imports, down from $217.13 billion to $210.68 billion, with goods exports rising from $135.61 billion to $137.39 billion. Aircraft orders and petroleum prices have helped to contribute to much of the wild swings over the past few months, and in January, the average price per barrel of imported crude oil ($42.59) dropped to the lowest level since December 2016. For the month, goods exports increased for automotive vehicles and parts, consumer goods and foods, feeds and beverages.
Encouragingly, there continues to be promising news on the export of manufactured products. In 2018, U.S.-manufactured goods exports rose 5.6 percent to just shy of $1.4 trillion, using new seasonally adjusted data from TradeStats Express. As such, last year’s export pace was not far from the all-time high recorded in 2014, which was just more than $1.4 trillion. For the first month of 2019, U.S.-manufactured goods exports totaled $88.24 billion using non-seasonally adjusted data, up 2.17 percent from $86.36 billion in January 2018.
- Kansas City Fed Manufacturing Survey: After slowing to the weakest pace of growth since November 2016 in February, manufacturing activity rebounded in March. The composite index rose from 1 in February to 10 in March, the best reading since November, with new orders, production, shipments and exports bouncing back from declines. Employment improved as well. Meanwhile, manufacturers also felt more upbeat about activity over the next six months. Nearly half of firms in the district predict increased orders in the coming months, with 42 percent and 34 percent seeing accelerated hiring and capital spending growth, respectively. On the downside, respondents cited trade uncertainties and workforce challenges as concerns.
- New Home Sales: New single-family home sales rebounded in the latest data, rising 4.9 percent from 636,000 units in January to 667,000 units in February. This was the best monthly reading in 11 months, with reduced mortgage rates likely helping to boost demand. Sales increased in every region of the country except for the West, which was unchanged in February. Despite the stronger data in the most recent release, new home sales have risen just 0.6 percent over the past 12 months, up from 663,000 units in February 2018, as increased construction costs and worker shortages have challenged the housing market.
With the uptick in sales, there were 6.1 months of supply on the market in February, down from 6.5 months in January and off from the recent high of 7.2 months in October. The median sales price was $315,300 in February, down 3.6 percent from one year ago.
- Personal Consumption Expenditures Deflator: The PCE deflator edged down 0.1 percent in January, the first decline since March 2017 and pulled lower by reduced energy costs, down 3.2 percent. The core PCE deflator, which excludes food and energy prices, increased 0.1 percent in January. Over the past 12 months, the PCE deflator has risen just 1.4 percent, the slowest year-over-year pace since September 2016. Core inflation decreased from 2.0 percent year-over-year in December to 1.8 percent in January, below the Federal Reserve’s stated goal of 2 percent. The moderation in the rate of price growth in recent months should provide some comfort to the Federal Open Market Committee, as it should allow the committee the luxury of being more “dovish” in setting monetary policy over the coming months.
The PCE deflator data for February were delayed due to the partial government shutdown.
- Personal Income and Spending: Personal income rose 0.2 percent in February, bouncing back after edging down 0.1 percent in January. On a year-over-year basis, personal income has risen 4.2 percent since February 2018. At the same time, total manufacturing compensation edged up from $892.3 billion in January to $893.6 billion in February, up a modest 1.5 percent from $880.6 billion one year ago.
Due to the partial government shutdown, the February personal spending data have been delayed. In January, personal consumption expenditures inched up 0.1 percent after falling 0.6 percent in December. Nondurable goods spending rose 0.3 percent in January, but consumers spent 1.2 percent less on durable goods. With that said, personal spending has still risen 3.7 percent year-over-year—a decent rate overall. This is a sign that Americans continue to make purchases at a decent clip even with softer data in the past few months.
On that note, the saving rate soared from 6.2 percent in November to 7.7 percent in December, the highest reading since January 2016. It declined to 7.5 percent in January.
- Richmond Fed Manufacturing Survey: After contracting in both December and January, manufacturing activity has now expanded for two straight months. With that said, the composite index of general business activity declined from 16 in February to 10 in March. New orders, shipments, capacity utilization and capital expenditures continued to expand, but with each at a slower pace in March. On the other hand, employment growth improved to the fastest rate in seven months, with firms continuing to cite an inability to find sufficient talent and with wage appreciation strong. In addition, survey respondents remained optimistic about further expansion over the next six months, with accelerated activity predicted for sales, shipments and capital spending.
Raw material costs rose 2.84 percent at the annual rate in March, down from 3.03 percent in February. While this suggested some stabilization, it also indicated still-elevated rates of growth for input costs. Moving forward, manufacturers see raw material prices rising by an annualized 2.10 percent six months from now, continuing to edge down and off from 2.48 percent in January.
- University of Michigan Consumer Sentiment: The Index of Consumer Sentiment rebounded for the second straight month, rising from 91.2 in January, the lowest level since September 2016, to 93.8 in February and 98.4 in March. This was higher than the preliminary estimate of 97.8 released a few weeks earlier. In general, Americans felt more upbeat in their income prospects, which helped boost overall confidence, both about the current economy and for future conditions. The data are consistent with personal spending growth of 2.6 percent in 2019.
|
|
|
Thank you for subscribing to the NAM’s Monday Economic Report.
If you’re part of an NAM member company and not yet subscribed, email us. If you’re not an NAM member, become one today!
|
|
|
|
|
|
|
|
|
|
|

