 |
| If you’re having trouble reading this, click here. |
|
| MONDAY ECONOMIC REPORT |
|
|
|
|
| Essential Takes on Leading Economic Indicators |
|
| By Chad Moutray, Ph.D., CBE – May 4, 2020 – SHARE |
|
|
| |
|
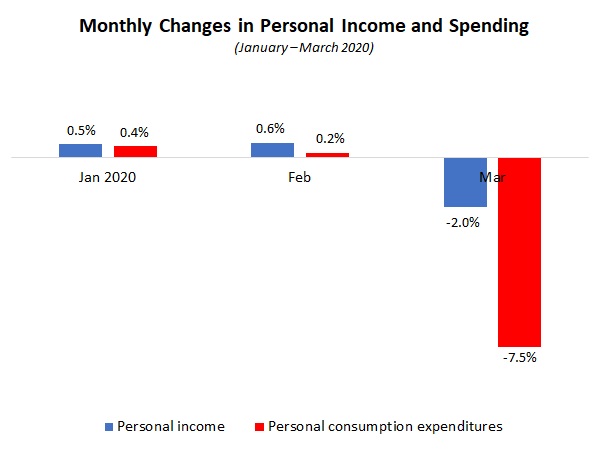
| Personal Spending Plunged by a Record 7.5% in March |
|
| The Weekly Toplines |
|
- Americans stayed home and reduced their overall spending in March, as consumers grappled with the COVID-19 outbreak. Personal consumption expenditures plummeted by a record 7.5% in March, with goods and service-sector spending down 3.1% and 9.5% for the month, respectively. Durable goods consumption declined a jaw-dropping 15.1% in March, but nondurable goods spending rose 3.1%, a figure that likely includes food and paper products.
- The saving rate soared from 8% in February to 13.1% in March, the highest rate since November 1982. At the same time, personal income decreased 2% in March, with 1.4% growth year-over-year.
- With sharp pullbacks in consumer and business activity, the U.S. economy shrank by an annualized 4.8% in the first quarter, the largest quarterly decline since the fourth quarter of 2008. The housing market and government spending were bright spots, but personal spending, nonresidential fixed investment and inventory spending were significant drags on growth. Slowing global trade activity, particularly for goods imports, made net exports the largest positive contributor to real GDP growth in the first quarter, but for the wrong reasons.
- The U.S. economy is expected to contract by a mind-numbingly large 30% at the annual rate, or perhaps more. Once the COVID-19 outbreak starts to abate, economic activity should improve, with real GDP rebounding strongly in the third quarter. Yet, the economic damage will have been done, with the U.S. economy declining 4.1% in 2020.
- The ISM® Manufacturing Purchasing Managers’ Index® fell at the quickest rate since April 2009, down from 49.1 in March to 41.5 in April. There was a record decline in production in the survey dating to January 1948. Likewise, the index for employment was the lowest since June 1949. New orders and exports both fell at rates not seen since December 2008. Roughly 60% of survey respondents in April said that sales and output were lower for the month.
- In a similar fashion, manufacturing activity in the Dallas and Richmond Federal Reserve Bank districts fell at the fastest paces on record in April, with the COVID-19 pandemic and sharply reduced energy prices challenging businesses in both regions. Respondents were also negative in their outlook for the next six months.
- There were 3,839,000 initial unemployment claims for the week ending April 25, down from the 4,442,000 claims added for the week ending April 18. These continue to be unprecedented levels, suggesting that 30.31 million Americans filed for unemployment insurance in the past six weeks as the economic toll of the COVID-19 crisis takes hold.
- Meanwhile, continuing claims increased from 15,818,000 for the week ending April 11 to 17,992,000 for the week ending April 18 in this report, a new all-time high. The latest figure suggests that 12.4% of the workforce received unemployment insurance that week, a rate that will continue to increase substantially given the initial claims data.
- The unemployment rate could peak around 20% or more this month before starting to fall. The current forecast is for the unemployment rate to be 9% to 10% by year’s end—a shocking turn of events in the labor market following February’s 50-year low, which registered 3.5%.
- According to the Conference Board, consumer confidence fell dramatically from 118.8 in March to 86.9 in April, the lowest level since June 2014. The decline in April stemmed from weakened assessments of the current economic environment, with that index experiencing the largest monthly drop on record, pulled lower by labor market and income worries. On the encouraging side, Americans felt cautiously optimistic for a rebound.
- The Federal Open Market Committee continued to keep interest rates historically low, with the federal funds rate at zero to 25 basis points, to help stabilize economic growth. Indeed, the Federal Reserve has already taken dramatic steps over the past few months, reducing rates by 150 basis points and introducing new lending programs to ensure adequate liquidity in business and financial markets.
- The FOMC will also continue to purchase securities aggressively over the coming weeks. The Federal Reserve’s balance sheet has already ballooned $2.5 trillion since the end of February, with total assets of nearly $6.7 trillion last week—a figure that is expected to exceed $10 trillion by summer.
|
 |
|
| Economic Indicators |
|
Last Week’s Indicators:
(Summaries Appear Below)
Monday, April 27
Dallas Fed Manufacturing Survey
Tuesday, April 28
Conference Board Consumer Confidence
International Trade in Goods (Preliminary)
Richmond Fed Manufacturing Survey
Wednesday, April 29
Business Employment Dynamics
FOMC Monetary Policy Statement
Gross Domestic Product (First Quarter)
Thursday, April 30
Employment Cost Index
Personal Consumption Expenditures Deflator
Personal Income and Spending
Weekly Initial Unemployment Claims
Friday, May 1
Construction Spending
ISM® Manufacturing Purchasing Managers’ Index® |
|
|
|
This Week's Indicators:
Monday, May 4
Factory Orders and Shipments
Tuesday, May 5
International Trade Report
Wednesday, May 6
ADP National Employment Report
Thursday, May 7
Consumer Credit
Productivity and Costs
Weekly Initial Unemployment Claims
Friday, May 8
BLS National Employment Report |
|
|
| Deeper Dive |
|
- Business Employment Dynamics: Net employment growth rose by 11,000 in the third quarter of 2019, slowing from gains of 525,000 and 182,000 in the first and second quarters, respectively. Manufacturers had gross job gains of 374,000 in the third quarter, with 338,000 from expanding establishments and 36,000 from new establishments. At the same time, gross job losses amounted to 441,000 in the third quarter, with 398,000 from contracting establishments and 43,000 from closing establishments. Therefore, there was a net employment change of 67,000 fewer workers in the manufacturing sector in the third quarter, extending the net loss of 10,000 in the second quarter.
In addition, there were 5,000 manufacturing start-ups in the third quarter, or a rate of 1.6% of all establishments in the sector. Those new establishments (or “births”) employed 21,000 workers in the third quarter, down from 24,000 in the second quarter. The pace of manufacturing start-ups has been relatively flat for about a decade, and notably, entrepreneurship in the sector (as well as economy-wide) has slowed from the rates in the 1990s and early 2000s.
- Conference Board Consumer Confidence: Consumer sentiment fell dramatically from 118.8 in March to 86.9 in April, the lowest level since June 2014, as Americans became more concerned with the COVID-19 outbreak and its implications. The decline in April stemmed from weakened assessments of the current economic environment, with that index down from 166.7 to 76.4, the largest monthly drop on record. On the encouraging side, Americans felt cautiously optimistic for a rebound, with the measure of expected conditions improving in April, up from 86.8 to 93.8.
The underlying data reflected the diminished perceptions about the current economy, with the percentage of respondents suggesting that business conditions were “bad” jumping from 11.7% to 45.2%. In contrast, the percentage feeling that conditions were “good” eased from 39.2% to 20.8%. Likewise, the percentage feeling jobs were “plentiful” declined from 43.3% to 20.0%, while those saying jobs were “hard to get” rose from 13.8% to 33.6%. With that said, consumers felt upbeat that the labor market might improve six months from now. Along those lines, respondents expecting more jobs in the next six months increased from 16.9% to 41.0%, while those predicting fewer jobs edged up from 17.6% to 20.8%.
- Construction Spending: Private manufacturing construction spending fell 0.7% in the latest data to a six-month low. It fell from $74.06 billion at the annual rate in February to $73.56 billion in March. This decrease likely foreshadows even larger declines in the April data, with manufacturers experiencing pullbacks in activity due to the COVID-19 outbreak. In March, construction activity in the sector decreased 2.4% year-over-year. Over the longer term, manufacturing construction activity remains well below the all-time high of $86.65 billion in June 2015.
Meanwhile, total private construction spending increased 0.7% in March, with private residential construction up 2.3% (largely on multifamily units) but nonresidential activity down 1.3% for the month. Private single-family home construction dropped 2.0% in March. Except for a slight increase in communication sector spending, all other segments of nonresidential businesses reported reduced construction for the month. On a year-over-year basis, private residential construction was up 8.8%, but nonresidential activity was off by 1.8%. At the same time, public construction activity rose 1.6% in March, with 7.9% growth over the past 12 months.
- Dallas Fed Manufacturing Survey: The composite index of general business activity in the Dallas Federal Reserve Bank’s district deteriorated further, down from -70.0 in March to -73.7 in April, once again dropping to the lowest level since the survey began in 2004. Manufacturers in the Texas region continued to struggle with the COVID-19 pandemic and sharply reduced energy prices. The underlying data were very weak across the board. Indeed, 72.2% of respondents said that new orders decreased in April, up from 51.3% who reported declines in March, with just 5.2% citing increased sales for the month. Moreover, nearly 60% noted reduced capital expenditures in April, with 24.1% suggesting that employment had fallen.
In addition, manufacturers in the district remained negative in their outlook, with the forward-looking composite index of business conditions dropping from -39.5 to -42.1, the lowest since November 2008.
In special questions, 73.7% of manufacturers in the Dallas Federal Reserve region reported they had applied for a Small Business Administration Paycheck Protection Program loan, and 23.2% noted they had laid off some employees. Almost 78% of manufacturers completing the survey felt that the reduction in hiring would be temporary. In terms of negative impacts from COVID-19, more than 68% had seen reductions in demand, production and capital spending, with 59.8% and 57.4% citing supply chain difficulties and reduced hours, respectively.
- Employment Cost Index: Private manufacturing wages and salaries rose 0.7% in the first quarter, slowing from the 0.8% gain in the fourth quarter. That translated into 3.1% growth over the past 12 months, just shy of the 3.2% growth rate in the fourth quarter, which was the fastest since the first quarter of 2002. For all private-sector employees, wages and salaries increased 1% in the first quarter, up from 0.7% in the fourth quarter, with 3.3% growth year-over-year and the best since the fourth quarter of 2007.
Benefits costs for manufacturing employees increased 0.2% in the first quarter, edging down from 0.3% growth in the fourth quarter and the slowest gain since the third quarter of 2018. On a year-over-year basis, benefits have risen a modest 1.3%. Overall, total manufacturing compensation increased 0.5% for the quarter, or 2.5% year-over-year.
- FOMC Monetary Policy Statement: The Federal Open Market Committee continued to keep interest rates historically low, with the federal funds rate at zero to 25 basis points, to help stabilize economic growth. Indeed, the Federal Reserve has already taken dramatic steps over the past few months, reducing rates by 150 basis points and introducing new lending programs to ensure adequate liquidity in business and financial markets. The FOMC frames the need for such monetary policy actions by stating, “The coronavirus outbreak is causing tremendous human and economic hardship across the United States and around the world. The virus and the measures taken to protect public health are inducing sharp declines in economic activity and a surge in job losses.”
Moreover, the Federal Reserve is expected “to maintain this target range until it is confident that the economy has weathered recent events and is on track to achieve its maximum employment and price stability goals.” The FOMC will also continue to purchase securities aggressively over the coming weeks. The Federal Reserve’s balance sheet has already ballooned $2.5 trillion since the end of February, with total assets of nearly $6.7 trillion last week—a figure that is expected to exceed $10 trillion by summer.
- Gross Domestic Product (First Quarter): The U.S. economy shrank by an annualized 4.8% in the first quarter, the largest quarterly decline since the fourth quarter of 2008, as the nation grappled with the COVID-19 outbreak and sharp pullbacks in consumer and business activity. Indeed, personal consumption expenditures fell 7.6% at the annual rate, the fastest decline in consumer spending since the second quarter of 1980, with Americans staying closer to home and retail businesses closed or at limited capacity. Breaking the consumer spending data down further:
- Durable goods spending plummeted 16.1% at the annual rate in the first quarter, the most since the fourth quarter of 2008, subtracting 1.21% from top-line GDP growth.
- Nondurable goods spending rose 6.9% in the first quarter, the best reading since the third quarter of 2003, contributing 0.94% to headline growth.
- Service-sector spending fell 10.2% in the first quarter, the worst quarter in the series’ history, which dates to 1947, subtracting 4.99% from top-line growth.
It should be stated that the real GDP data for the second quarter will be worse, with the U.S. economy expected to contract by a mind-numbingly large 30% at the annual rate, or perhaps more. Once the COVID-19 outbreak starts to abate, economic activity should improve, with real GDP rebounding strongly in the third quarter. Yet, the economic damage will have been done, with the U.S. economy declining 4.1% in 2020.
Other highlights in the latest release:
- The housing market and government spending were bright spots. In the first quarter, residential investment jumped 21% at the annual rate, adding 0.74% to top-line GDP growth. The combination of both federal and state and local government spending contributed another 0.13%.
- Nonresidential fixed investment fell 8.6% in the first quarter, the weakest reading since the second quarter of 2009, with sharp declines in business spending for equipment and structures, down 15.2% and 9.7%, respectively. Nonresidential fixed investment subtracted 1.17% from headline growth, dragging down GDP for the fourth straight quarter.
- Businesses continued to spend less to stock their shelves, with inventories dragging down real GDP growth for the fourth straight quarter, subtracting 0.53% in the latest data.
- Net exports were the largest positive contributor to real GDP growth in the first quarter, adding 1.30% to top-line growth, but it was for the wrong reasons. Slowing global growth reduced trade activity, with goods exports and imports down 1.2% and 15.3%, respectively.
- International Trade in Goods (Preliminary): In advance statistics, the goods trade deficit rose from $59.89 billion in February to $64.22 billion in March. The increase in the goods trade deficit stemmed from a sharp reduction in goods exports, down from $136.74 billion to $127.64 billion, a pace not seen since May 2017. Sizable declines occurred in exports for automotive vehicles, capital goods, consumer goods and industrial supplies in March as global economies slowed due to the COVID-19 pandemic. At the same time, goods imports also decreased, down from $196.63 billion to $191.87 billion, the slowest rate since February 2017, led by weaknesses for automotive vehicles and consumer goods. Final data will be released May 5, which will also include the service-sector trade surplus.
- ISM® Manufacturing Purchasing Managers’ Index®: The Institute for Supply Management® reported that manufacturing activity fell at the quickest rate since April 2009, with firms grappling with major disruptions due to the COVID-19 outbreak and sharply decreased energy prices. The headline index fell from 49.1 in March to 41.5 in April, and there was a record decline in production (down from 47.7 to 27.5) for a survey that dates to January 1948. Likewise, the index for employment (down from 43.8 to 27.5) was the lowest since June 1949. New orders (down from 42.2 to 27.1) and exports (down from 46.6 to 35.3) both fell at rates not seen since December 2008. Roughly 60% of survey respondents in April said that sales and output were lower for the month, with the sample comments highlighting the severe challenges to the sector as manufacturers cope with reduced operations.
With Americans staying closer to home, two sectors saw increased production and were bright spots in April: food, beverage and tobacco products and paper products. That should be a surprise to no one.
Given the weakened global economy, raw material prices (down from 37.4 to 35.3) contracted at the fastest rate since January 2016, with deflationary pressures in the sector. In April, 39.4% reported lower prices, with 50.6% suggesting that costs had remained the same and 10% citing increases. Meanwhile, inventories (up from 46.9 to 49.7) fell for the 11th consecutive month, albeit at a slower rate of decline in April.
- Personal Consumption Expenditures Deflator: The PCE deflator decreased 0.3% in March. Reduced energy costs, which fell 6.1% in March, helped to keep a lid on price growth for the month despite food costs rising 0.6%. The core PCE deflator, which excludes food and energy prices, edged down 0.1% in March, with prices for goods off 0.9% for the month. Since March 2019, the PCE deflator has risen 1.3%, down from 1.8% year-over-year in February. Core inflation registered 1.7% year-over-year in March, inching down from 1.8% in February.
Overall, the core PCE deflator has remained below the Federal Reserve’s stated goal of 2% core inflation for 15 straight months. As such, inflationary pressures are not a concern for the Federal Open Market Committee currently. Instead, especially in light of the current COVID-19 crisis, the Federal Reserve is more concerned with a contracting U.S. and global economy and likely deflationary pressures from a downturn. Indeed, the Federal Reserve has undertaken extraordinary measures in recent weeks to help prop up the economy and to address credit and liquidity concerns in financial markets.
- Personal Income and Spending: Americans stayed home and reduced their overall spending in March, as consumers grappled with the COVID-19 outbreak. Personal consumption expenditures plummeted by a record 7.5% in March (with data dating back to 1959), with goods and service-sector spending down 3.1% and 9.5% for the month, respectively. Durable goods consumption declined a jaw-dropping 15.1% in March, but nondurable goods spending rose 3.1%, a figure that likely includes food and paper products. On a year-over-year basis, personal spending fell 3.8%, with durable goods and service-sector consumption down 12.9% and 5.3% year-over-year, respectively. In contrast, nondurable goods spending has risen 6% since March 2019.
At the same time, personal income decreased 2% in March, with 1.4% growth year-over-year. Manufacturing wages and salaries fell from $917.7 billion in February to $877.1 billion in March, representing a decline of 3.8% over the past 12 months.
With Americans pulling back drastically on spending, the saving rate soared from 8% in February to 13.1% in March, the highest rate since November 1982.
- Richmond Fed Manufacturing Survey: Manufacturing activity plummeted in April to the lowest level in the survey’s history, which dates to November 1993. The composite index of general business activity fell from 2 in March to -53 in April, with sizable declines across the board, including for new orders, shipments, capacity utilization, employment, the average workweek and capital spending. Moreover, respondents remained negative in their expectations of activity for the next six months, albeit with some easing in the anticipated rates of decline for new orders and shipments. Respondents predicted employment to decrease for the first time since July 2009, and manufacturers in the region suggested that they would more easily find the workers and skills necessary for their operations, with the first positive reading for that measure since December 2017.
Raw material costs increased 1.48% at the annual rate in April, up from 1.29% in March but down from 1.95% in February. In addition, manufacturers predict a slight easing in input price growth moving forward, with respondents expecting an annualized 1.93% increase six months from now, down from 1.99% in the prior survey.
- Weekly Initial Unemployment Claims: There were 3,839,000 initial unemployment claims for the week ending April 25, down from the 4,442,000 claims added for the week ending April 18. These continue to be unprecedented levels, suggesting that 30.31 million Americans filed for unemployment insurance in the past six weeks as the economic toll of the COVID-19 crisis takes hold. California, Florida, Georgia, New York, Pennsylvania, Texas and Washington each had at least 100,000 initial unemployment claims in the latest week, with 22 states having new claims that exceeded 50,000.
Meanwhile, continuing claims increased from 15,818,000 for the week ending April 11 to 17,992,000 for the week ending April 18 in this report, a new all-time high. The latest figure suggests that 12.4% of the workforce received unemployment insurance that week, a rate that will continue to increase substantially given the initial claims data.
The unemployment rate could peak around 20% or more this month before starting to fall. The current forecast is for the unemployment rate to be 9% to 10% by year’s end—a shocking turn of events in the labor market following February’s 50-year low, which registered 3.5%.
|
|
Thank you for subscribing to the NAM's Monday Economic Report.
If you're part of an NAM member company and not yet subscribed, email us. If you're not an NAM member, become one today!
|
|
|
|
|
|
|
|
|
| Interested in becoming a presenter of the Monday Economic Report? Email us. |
|
| Questions or comments? Email NAM Chief Economist Chad Moutray at [email protected]. |
|
| You received this email because you signed up for the NAM's Monday Economic Report as a part of your NAM membership. |
|
| Unsubscribe |
|
| © 2020 National Association of Manufacturers |
|
 |
|
|
|
|
|
|
|
|
