 |
| If you’re having trouble reading this, click here. |
 |
|
|
|
| MONDAY ECONOMIC REPORT |
| Essential Takes on Leading Economic Indicators |
|
| By Chad Moutray, Ph.D., CBE - October 29, 2018 |
|
| Presented by Microsoft |
|
|
|
|
Economy Keeps Motoring Along Through Third Quarter |
|
 |
|
| The Weekly Toplines |
|
- The U.S. economy grew 3.5 percent in the third quarter at the annual rate, buoyed by consumer and government spending and inventories, with notable drags from net exports and housing as expected.
- Real GDP growth continues to be on track for 3 percent growth in 2018, the best year since 2005, with tax reform and a changed regulatory environment helping to propel increased activity this year. For their part, manufacturers remain very upbeat in their outlook, with the sector being one of the bright spots in the economy right now.
- Modest growth in manufacturing activity continued in the Kansas City and Richmond Federal Reserve Bank districts, even with both recording some softening in the October data. Raw material costs increased significantly in the Richmond Federal Reserve’s survey. Meanwhile, durable goods orders rose 0.8 percent in September, with a robust 7.9 percent growth rate over the past 12 months.
- On the heels of disappointing housing starts data the week before, there were more signs that the residential market remains weaker than desired. New home sales fell 5.5 percent in September, the slowest pace since December 2016. This is a further sign of how much higher mortgage rates, increased construction costs and worker shortages have challenged the housing market, but Hurricane Florence also likely negatively impacted the September data.
- Financial markets continued to be highly volatile last week, with the Dow Jones Industrial Average down roughly 8 percent since October 3.
|
|
| Economic Indicators |
|
Last Week's Indicators:
(Summaries Appear Below)
Monday, October 22
Chicago Fed National Activity Index
Tuesday, October 23
Richmond Fed Manufacturing Survey
Wednesday, October 24
IHS Markit® Flash Manufacturing PMIs® for the United States and Eurozone
New Home Sales
Thursday, October 25
Durable Goods Orders and Shipments
International Trade in Goods (Preliminary)
Kansas City Fed Manufacturing Survey
Friday, October 26
Gross Domestic Product
University of Michigan Consumer Sentiment
|
|
|
|
This Week's Indicators:
Monday, October 29
Dallas Fed Manufacturing Survey
Personal Income and Spending
Tuesday, October 30
Conference Board Consumer Confidence
Wednesday, October 31
ADP National Employment Report
Employment Cost Index
Thursday, November 1
Construction Spending
Gross Domestic Product by Industry
ISM® Manufacturing Purchasing Managers’ Index®
Productivity and Costs
Friday, November 2
BLS National Employment Report
International Trade Report
|
|
|
| Deeper Dive |
|
- Chicago Fed National Activity Index: The Chicago Federal Reserve Bank reported that the U.S. economy continued to expand modestly but with some moderation in September. The National Activity Index (NAI) declined from 0.27 in August to 0.17 in September, with positive readings suggesting that economic growth is increasing above its historical trend.
- Durable Goods Orders and Shipments: New durable goods orders rose 0.8 percent in September, largely on a significant increase in defense aircraft sales. Excluding transportation, new orders inched up 0.1 percent. More importantly, new durable goods orders have jumped 7.9 percent over the past 12 months, or 5.9 percent year-over-year with transportation equipment sales excluded. These measures suggest robust gains over the past year.
In addition, core capital goods (or nondefense capital goods excluding aircraft) spending—a proxy for capital investment activity in the U.S. economy—edged down 0.1 percent in September but has risen a modest 4.1 percent year to date.
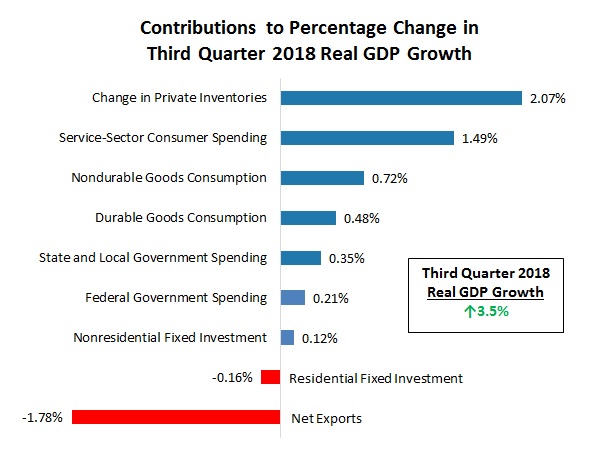
- Gross Domestic Product: The U.S. economy grew an annualized 3.5 percent in the third quarter, slowing from 4.2 percent growth in the second quarter but continuing to reflect a solid expansion overall. Consumer and government purchases, along with robust spending on inventories, helped to buoy economic growth for the quarter, with notable drags from net exports and the housing market. Business investment also cooled, primarily from spending on structures. Moving forward, real GDP should grow 3 percent in 2018, which would be the strongest growth rate since 2005.
Some highlights:
- Consumer spending on goods grew a very healthy 5.8 percent at the annual rate in the third quarter, with personal consumption expenditures contributing 2.69 percentage points to top-line real GDP growth for the quarter.
- Nonresidential fixed investment rose just 0.8 percent in the third quarter at the annual rate, the slowest pace in nearly two years, largely on a decline in structures spending and more sluggish investments in equipment. Residential investment decreased 4.0 percent, falling for the third straight quarter.
- Inventory spending alone added 2.07 percentage points to headline growth.
- Goods exports decreased an annualized 7.0 percent in the third quarter, the first decline since the fourth quarter of 2016. At the same time, goods imports jumped 10.3 percent. As a result, net exports subtracted 1.78 percentage points from real GDP.
- IHS Markit® Flash Eurozone Manufacturing PMI®: Eurozone manufacturing activity eased to the slowest pace since August 2016, with the composite index dropping from 53.2 in September to 52.1 in October. New orders contracted in October for the first time since November 2014, pulled lower by reduced exports, and output expanded at the weakest pace since December 2014. The manufacturing data for France and Germany were similar, with activity expanding at two-year lows in both markets in preliminary figures. On the positive side, survey respondents continue to anticipate modest growth in production for the months ahead.
- IHS Markit® Flash United States Manufacturing PMI®: The headline composite index rose from 55.6 in September to 55.9 in October, a five-month high, boosted by stronger sales and hiring growth. Exports slowed to being almost stagnant for the month, and input prices remained highly elevated. Encouragingly, the future output index increased from 65.8 to 71.2, a sign that manufacturers anticipate robust growth in output over the next six months.
- International Trade in Goods (Preliminary): In advance statistics, the goods trade deficit widened from $75.46 billion in August to $76.04 billion in September, the highest level since February. Goods exports increased but not enough to offset the pickup in goods imports. Final data will be released November 2.
- Kansas City Fed Manufacturing Survey: Manufacturing activity decelerated in October, weakening to the slowest expansion since December 2016 on reduced growth in new orders and production. On the other hand, shipments and employment rebounded for the month, and business leaders in the district maintained a strong outlook for growth over the coming six months. Raw material costs have moderated over the past few months but remain very elevated, both for the month and in forward-looking expectations. About one-half of respondents said tariffs have played a role in increasing input costs.
- New Home Sales: New single-family home sales fell 5.5 percent in September, down to an annualized 553,000 units sold, the slowest pace since December 2016. Six months ago, there were 672,000 units sold—a sign of just how dramatically activity has slipped in recent months, with higher mortgage rates, increased construction costs and worker shortages challenging the housing market. Hurricane Florence also likely played a factor in September’s decline. There are 7.1 months of supply on the market, the most since March 2011 and up from 5.3 months in March of this year.
- Richmond Fed Manufacturing Survey: Manufacturing activity in the district continued to expand modestly in October but slowed from September’s pace. Growth in new orders, shipments and capital expenditures eased a little, but hiring strengthened once again. Looking ahead, respondents remained very upbeat about growth for the next six months.
On the downside, firms continue to struggle with finding talent, and pricing pressures accelerated strongly. Respondents said input costs jumped 5.68 percent for the month, the highest since May 2011 and up from 3.47 percent last month. Over the next six months, manufacturers expect raw material costs to rise 3.87 percent, up from 3.04 percent in the prior survey.
- University of Michigan Consumer Sentiment: The Index of Consumer Sentiment declined from 100.1 in September to 98.6 in October. Even as the public’s perceptions about the economy have slipped somewhat since March’s reading (101.4), which was the highest since January 2004, the data remain upbeat. The data are currently consistent with 2.6 percent growth in real consumer spending over the next 12 months.
|
|
| A Message from Microsoft |
|
 |
|
| Find out how digital transformation is shaping the manufacturing industry.
|
|
| Take Action |
|
- If you participated in a Manufacturing Day event in any capacity, we want to hear from you about your experience! As part of our efforts to learn more about the impact of Manufacturing Day, please take a moment to fill out our survey or print out, scan and email this pdf to [email protected]. Please share the survey with your event attendees, including students, teachers and parents. Responses will be kept confidential, and the results will be posted online when complete. The deadline is Wednesday, October 31, at 5:00 p.m. EDT.
|
|
Thank you for subscribing to the NAM’s Monday Economic Report.
If you’re part of an NAM member company and not yet subscribed, email us. If you’re not an NAM member, become one today!
|
|
|
|
|
|
|
|
|
|
|
|
