 |
| If you’re having trouble reading this, click here. |
 |
|
|
|
| MONDAY ECONOMIC REPORT |
| Essential Takes on Leading Economic Indicators |
|
| By Chad Moutray, Ph.D., CBE – December 3, 2018 |
|
| Presented by Microsoft |
|
|
|
|
U.S. Economy Grew 3.5 Percent in the Third Quarter, on Track for Roughly 3 Percent Growth in 2018 |
|
| The Weekly Toplines |
|
- The U.S. economy grew an annualized 3.5 percent in the third quarter. While this reflects some easing from the 4.2 percent growth rate in the second quarter, it continued to indicate solid expansion overall. Consumer and government purchases, along with robust spending on inventories, helped to buoy economic growth for the quarter, with notable drags from net exports and the housing market.
- Moving forward, the current forecast for fourth quarter growth is 2.8 percent. Real GDP should grow roughly 3 percent in 2018, which would be the strongest growth rate since 2005, and growth in 2019 is predicted to be 2.5 percent.
- In a speech at The Economic Club of New York, Federal Reserve Chairman Jerome Powell said the Federal Open Market Committee (FOMC) had “no preset policy path,” with future monetary policy decisions hinging on incoming data. Financial markets reacted favorably to his comments (and those from Vice Chairman Richard Clarida) on the assumption that the Federal Reserve might pause on rate hikes at some point, particularly if it sees some softening. The minutes of the prior FOMC meeting also seemed to confirm that thinking. With that said, the FOMC is still widely expected to increase the federal funds rate by 25 basis points at its December 18–19 meeting. His comments, if anything, have more to do with the number of possible rate hikes for 2019.
- The FOMC did get some encouraging news from the latest inflation data. The personal consumption expenditures (PCE) deflator—the Federal Reserve’s preferred inflation measure—rose 0.2 percent in October, with 2.0 percent growth over the past 12 months. Excluding food and energy costs, core PCE inflation fell to 1.8 percent year-over-year in October, indicating some moderation in pricing pressures over the past few months.
- Personal spending jumped 0.6 percent in October, the fastest monthly pace since March and a sign that American consumers stepped up their spending leading into the all-important holiday season. (Along those lines, holiday spending has been quite robust so far, especially on Cyber Monday.) More important, personal spending has risen a robust 5.0 percent over the past 12 months. For its part, consumer confidence eased somewhat in November but remained not far from its 18-year high.
- In other news, manufacturing activity decelerated in both the Dallas and Richmond Federal Reserve Bank districts in November, but the outlook for the next six months remained quite positive. Meanwhile, residential construction data continued to disappoint, with new home sales plunging 8.9 percent in October to the slowest pace since February 2016.
|
 |
|
| Economic Indicators |
|
Last Week's Indicators:
(Summaries Appear Below)
Monday, November 26
Chicago Fed National Activity Index
Dallas Fed Manufacturing Survey
Tuesday, November 27
Conference Board Consumer Confidence
Wednesday, November 28
Gross Domestic Product (Revision)
International Trade in Goods (Preliminary)
New Home Sales
Richmond Fed Manufacturing Survey
Thursday, November 29
Personal Consumption Expenditures (PCE) Deflator
Personal Income and Spending
Friday, November 30
None |
|
|
|
This Week's Indicators:
Monday, December 3
Construction Spending
ISM® Manufacturing Purchasing Managers’ Index®
Tuesday, December 4
None
Wednesday, December 5
ADP National Employment Report
Beige Book
Productivity and Costs (Revision)
Thursday, December 6
Factory Orders and Shipments
International Trade Report
Friday, December 7
BLS National Employment Report
University of Michigan Consumer Sentiment |
|
|
| Deeper Dive |
|
- Chicago Fed National Activity Index: The Chicago Federal Reserve Bank reported that the U.S. economy continued to expand modestly, accelerating slightly in October from September’s pace. The National Activity Index (NAI) increased from 0.14 in September to 0.24 in October, with positive readings suggesting that economic growth is increasing above the historical trend. Production-related indicators contributed 0.06 to the NAI in this release, off from 0.09 in the prior report, mainly on slowing industrial production from the mining and utilities segments. At the same time, manufacturing production has risen for five straight months, with output in the sector up 2.7 percent year-over-year.
- Conference Board Consumer Confidence: Consumer sentiment pulled back from the highest level since September 2000, with the headline index down from 137.9 in October to 135.7 in November. Still, Americans continued to be mostly positive overall. Indeed, the percentage of respondents saying business conditions were “good” inched up from 41.0 percent to 41.2 percent, and the percentage suggesting jobs were “plentiful” rose from 45.4 percent to 46.6 percent. At the same time, consumer expectations about future conditions declined, down from 115.1 to 111.0, which explained the easing in the main index.
- Dallas Fed Manufacturing Survey: Manufacturing activity decelerated in November to a 15-month low but continued to expand modestly. Growth in new orders, production, employment and capital expenditures eased in November, but nearly 30 percent of respondents cited rising sales for the month, with 50.5 percent noting unchanged orders. Despite the softening in the current data, manufacturers in the Texas district remained optimistic about the next six months, with accelerated expectations for activity in most of the key measures. More than half of those completing the survey predict increased demand and production over the coming months, with 46.6 percent forecasting more hiring and 40.9 percent anticipating additional capital investments. In a special question, two-thirds of respondents say they are having trouble finding workers.
- Gross Domestic Product (Revision): The U.S. economy grew an annualized 3.5 percent in the third quarter, unchanged from the prior estimate. While this reflects some easing from the 4.2 percent growth rate in the second quarter, it continued to indicate solid expansion overall. In the updated data, there were upward revisions for nonresidential fixed investment and inventory spending that were essentially offset by downward revisions from durable goods spending, state and local government spending and net exports. In terms of overarching trends, consumer and government purchases, along with robust spending on inventories, helped to buoy economic growth for the quarter, with notable drags from net exports and the housing market.
Moving forward, the current forecast for fourth quarter growth is 2.8 percent. Real GDP should grow roughly 3 percent in 2018, which would be the strongest growth rate since 2005, and growth in 2019 is predicted to be 2.5 percent.
Some highlights of the current release:
- Consumer spending on goods grew 4.8 percent at the annual rate in the third quarter, with personal consumption expenditures contributing 2.45 percentage points to top-line real GDP growth for the quarter.
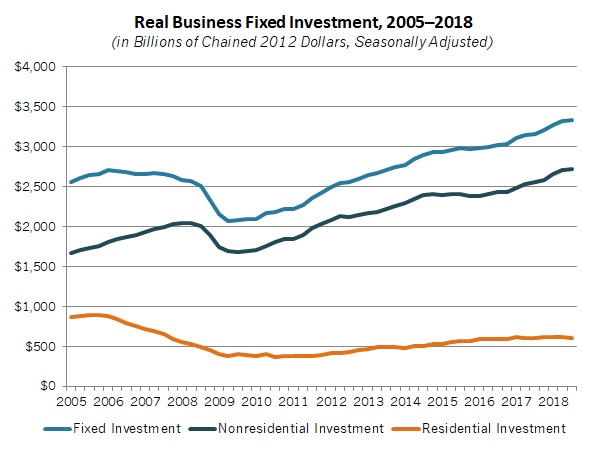
- Nonresidential fixed investment rose 2.5 percent at the annual rate in the third quarter, the slowest pace in nearly two years but notably better than the prior estimate of just 0.8 percent. The deceleration in the third quarter stemmed largely from a decline in structures spending.
- Residential investment decreased 2.6 percent, falling for the third straight quarter.
- Inventory spending alone added 2.27 percentage points to headline growth.
- Goods exports decreased an annualized 8.1 percent in the third quarter, the first decline since the fourth quarter of 2016. At the same time, goods imports jumped 10.3 percent. As a result, net exports subtracted 1.91 percentage points from real GDP.
- International Trade in Goods (Preliminary): In advance statistics, the goods trade deficit widened from $76.25 billion in September to $77.25 billion in October, the highest level since June 2008. The uptick in the trade deficit in October stemmed from reduced goods exports (down $786 million) that corresponded with a slight uptick in goods imports (up $210 million). Final data will be released December 6.
- New Home Sales: New single-family home sales fell 8.9 percent in October, down to an annualized 544,000 units sold, the slowest pace since February 2016. In contrast, there were 712,000 units sold in November 2017 (the best reading in 10 years)—a sign of just how dramatically activity has slipped in recent months. Higher mortgage rates, increased construction costs and worker shortages have challenged the housing market across 2018, with new home sales off 12.0 percent year-over-year. Moreover, there were 7.4 months of supply on the market, the most since February 2011 and up from 4.9 months in November 2017. In addition, the median sales price was $309,700 in October, down 3.1 percent from one year ago.
- Personal Consumption Expenditures (PCE) Deflator: The PCE deflator—the Federal Reserve’s preferred inflation measure—rose 0.2 percent in October after four straight months of 0.1 percent gains. At the same time, core inflation, which excludes food and energy, edged up 0.1 percent. On a year-over-year basis, the PCE deflator has risen 2.0 percent over the past 12 months, mirroring the rate in September and down from 2.3 percent in July. Excluding food and energy, core PCE inflation fell from 1.9 percent year-over-year in September to 1.8 percent in October. As such, core inflation has pulled back somewhat from the Federal Reserve’s target of 2 percent year-over-year growth, indicating some moderation over the past few months. This should take some pressure off the Federal Open Market Committee to react to possible overheating in the U.S. economy.
- Personal Income and Spending: Personal spending jumped 0.6 percent in October, the fastest monthly pace since March and a sign that American consumers stepped up their spending leading into the all-important holiday season. Spending for durable and nondurable goods rose 0.5 percent and 0.6 percent, respectively, in October. More importantly, personal spending has risen a robust 5.0 percent over the past 12 months, up from 4.8 percent in the prior report. The saving rate registered 6.2 percent in October, and the decline in the saving rate from 7.4 percent in February corresponds with the acceleration in spending since that point.
Meanwhile, personal income increased 0.5 percent in October, with 4.3 percent year-over-year growth. Manufacturing wages and salaries inched up from $873.1 billion in September to $874.8 billion in October, up 2.4 percent from $854.7 billion one year ago.
- Richmond Fed Manufacturing Survey: Manufacturers in the district reported that activity continued to expand modestly in November, albeit with some slowing to a seven-month low. Growth in new orders, capacity utilization, employment and capital expenditures eased for the month, but each measure reflected positive expansions in activity. At the same time, workforce challenges remained significant, and wage growth was one of the few key measures that accelerated in November. That is not expected to change over the next six months. In terms of the economic outlook, respondents remained very upbeat about the coming months. On the negative side, raw material costs rose 4.70 percent at the annual rate in November, with input prices predicted to grow by 3.92 percent over the next six months. This would indicate highly elevated pricing pressures, both now and moving forward.
|
|
| A Message from Microsoft |
|
 |
|
| Are you ready to modernize your manufacturing business? Take our digital transformation assessment. Start your journey today.
|
|
| Take Action |
|
- If you have not already done so, please take a moment to complete the latest NAM Manufacturers’ Outlook Survey. This 26-question survey will help us gauge how manufacturing sentiment has changed since the third quarter survey, which continued to show highly elevated levels of confidence and expected activity among respondents. The survey includes some special questions on trade uncertainties, infrastructure, workforce, tax reform and proxy advisory firms. To complete the survey, click here. Responses are due by Wednesday, December 12, at 12:00 p.m. EST. As always, all responses are anonymous.
|
|
Thank you for subscribing to the NAM’s Monday Economic Report.
If you’re part of an NAM member company and not yet subscribed, email us. If you’re not an NAM member, become one today!
|
|
|
|
|
|
|
|
|
|
|
|
