 |
| If you’re having trouble reading this, click here. |
|
| MONDAY ECONOMIC REPORT |
|
|
|
|
| Essential Takes on Leading Economic Indicators |
|
By Chad Moutray, Ph.D., CBE – January 22, 2019 – SHARE


|
|
<
|
|
|
| Manufacturing Capacity Utilization Rises to Best Reading in Four Years |
|
| The Weekly Toplines |
|
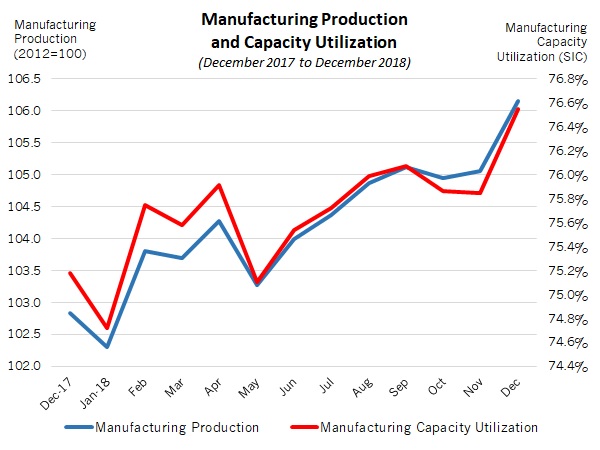
- Manufacturing production rebounded strongly in December after some softness in the prior three months, jumping 1.1 percent for the month. Over the past 12 months, manufacturing production has risen 3.2 percent. More importantly, manufacturing capacity utilization soared from 75.8 percent in November to 76.5 percent in December, the best reading since November 2014.
- Meanwhile, total industrial production rose 0.3 percent in December, inching down a bit from the 0.4 percent gain in November. On a year-over-year basis, industrial production has risen 4.0 percent—a solid reading—and total capacity utilization edged up from 78.6 percent to 78.7 percent, which was the highest since January 2015.
- The regional data out last week for January manufacturing activity from the New York and Philadelphia Federal Reserve Banks provided mixed news. In the Empire State Manufacturing Survey, respondents noted the slowest pace of growth since May 2017, with new orders, shipments and employment softening. In contrast, the Philadelphia Federal Reserve report reflected activity that rebounded in January from weaknesses in December. The good news is that manufacturers in both districts felt positive in their outlook for the next six months.
- Those surveys also noted stabilizing raw material costs. This was further supported by the latest producer price index data, which declined 0.2 percent in December, largely on reduced energy costs. Excluding food, energy and trade services, core inflation for goods inched up 0.1 percent in December.
- Over the past 12 months, producer prices for final demand goods and services have risen 2.4 percent, or 2.8 percent year-over-year with food, energy and trade services excluded. As such, core pricing pressures remain elevated, especially relative to what firms had become accustomed to, but on the positive side, these costs appear to have stabilized for the time being.
- New data on housing starts and retail sales were not released on schedule due to the partial government shutdown. With that said, several economic anxieties led consumer sentiment sharply lower in preliminary University of Michigan survey data, down to the lowest point since October 2016.
|
 |
|
| Economic Indicators |
|
Last Week's Indicators:
(Summaries Appear Below)
Monday, January 14
None
Tuesday, January 15
New York Fed Manufacturing Survey
Producer Price Index
Wednesday, January 16
NAHB Housing Market Index
Retail Sales*
Thursday, January 17
Housing Starts and Permits*
Philadelphia Fed Manufacturing Survey
Friday, January 18
Industrial Production
State Employment Report
University of Michigan Consumer Sentiment
|
|
|
|
This Week's Indicators:
Monday, January 21
MARTIN LUTHER KING JR. DAY
Tuesday, January 22
Existing Home Sales
Wednesday, January 23
Richmond Fed Manufacturing Survey
Thursday, January 24
Conference Board Leading Indicators
GDP by Industry*
IHS Markit Flash U.S. Manufacturing PMI
Kansas City Fed Manufacturing Survey
Friday, January 25
Durable Goods Orders and Shipments*
New Home Sales*
*This indicator will not be released on schedule due to the partial government shutdown. |
|
|
| Deeper Dive |
|
- Housing Starts and Permits: This indicator from the Census Bureau will be updated once the partial government shutdown ends.
- Industrial Production: Manufacturing production rebounded strongly in December after some softness in the prior three months, jumping 1.1 percent for the month. In the December data, durable and nondurable goods output rose 1.3 percent and 0.9 percent, respectively, led by solid gains for motor vehicles and parts, petroleum and coal products and nonmetallic mineral products, among others. In contrast, production declined in December for machinery, paper and textile and product mills. Over the past 12 months, manufacturing production has risen 3.2 percent. More importantly, manufacturing capacity utilization soared from 75.8 percent in November to 76.5 percent in December, the best reading since November 2014.
Meanwhile, total industrial production rose 0.3 percent in December, inching down a bit from the 0.4 percent gain in November. In addition to manufacturing, mining production increased 1.5 percent in December, but utilities output declined 6.3 percent. On a year-over-year basis, industrial production has risen 4.0 percent—a solid reading—and total capacity utilization edged up from 78.6 percent to 78.7 percent, which was the highest since January 2015.
- NAHB Housing Market Index: The National Association of Home Builders reported that confidence inched up in January after falling to the lowest level in more than two years in December. The Housing Market Index increased from 56 in December to 58 in January, with reduced mortgage rates helping to lift demand. Index readings greater than 50 indicate that more homebuilders are positive in their outlook than negative, and on that score, respondents continue to be mostly upbeat. Indeed, builders’ views of expected single-family sales over the next six months improved in January (up from 61 to 64), which was encouraging. Still, the headline index remained below 60 for the second straight month, with respondents continuing to cite challenges with higher construction costs and worker shortages.
- New York Fed Manufacturing Survey: Manufacturing activity grew at the slowest pace since May 2017, with the headline index down from 11.5 in December to 3.9 in January. (Note that the report reflects a new seasonal adjustment for historical data.) New orders, shipments and employment each softened for the month, albeit with still modest growth overall. More importantly, respondents to the Empire State Manufacturing Survey remain positive in their outlook for the next six months, even with some easing in confidence over the past few releases. Along those lines, nearly 40 percent predict sales growth over the coming months, down from 48.1 percent in December. On the downside, raw material costs continued to be highly elevated despite some deceleration, as roughly 52 percent of respondents expect higher input prices over the next six months.
- Philadelphia Fed Manufacturing Survey: Manufacturing activity improved in January after slowing to the weakest rate of growth since August 2016 in December. The composite index of general business activity rose from 9.1 in December to 17.0 in January, buoyed by stronger expansions for new orders and the average employee workweek. With that said, shipments and employment growth slowed a little in January from the prior survey. Moving forward, manufacturers in the Philadelphia Federal Reserve Bank region remain optimistic about the next six months. Respondents see the labor market staying quite tight and expect sales and capital spending plans to increase strongly in the coming months. In addition, respondents expect raw material prices to moderate, even at elevated levels.
- Producer Price Index: Producer prices for final demand goods and services declined 0.2 percent in December, falling for the first time since February 2017. Producer prices for final demand goods decreased 0.4 percent in December for the second straight month (and falling for the third time in the past four months), pulled lower by reduced energy costs. That was enough to offset higher food prices. Core inflation for goods, which excludes food, energy and trade services, inched up 0.1 percent in December, slowing after rising 0.3 percent in November.
Over the past 12 months, producer prices for final demand goods and services have risen 2.4 percent, or 2.8 percent year-over-year with food, energy and trade services excluded. As such, core pricing pressures remain elevated, especially relative to what firms had become accustomed to, but on the positive side, these costs appear to have stabilized for the time being. As a reference, core producer price inflation registered 3.0 percent year-over-year in August and September, with some slight deceleration in the series since then.
- Retail Sales: This indicator from the Census Bureau will be updated once the partial government shutdown ends.
- State Employment Report: Texas created the most net new manufacturing jobs in December, adding 3,100 workers. Virginia (up 2,600), Alabama (up 2,300), Ohio (up 2,300), North Carolina (up 2,200) and Georgia (up 2,000) also topped the list of manufacturing employment gains in December. In addition, Texas also saw the greatest job gains in the sector over the past 12 months, with manufacturing employment in the state up 38,600 since December 2017. Other states with the fastest manufacturing job growth year-over-year included Wisconsin (up 17,800), Florida (up 12,700), Washington (up 12,000), Virginia (up 11,700), Alabama (up 11,300) and Ohio (up 10,400). Meanwhile, Iowa had the lowest unemployment rate in the nation in December at 2.4 percent.
- University of Michigan Consumer Sentiment: The Index of Consumer Sentiment plummeted from 98.3 in December to 90.7 in January, according to preliminary figures. This was the lowest level since October 2016, and the press release cited several factors, including “the partial government shutdown, the impact of tariffs, instabilities in financial markets, the global slowdown and the lack of clarity about monetary policies.” Americans felt less upbeat in both their current and expected assessments of the economy. Final data will be released February 1.
|
|
| Take Action |
|
- Please consider participating in a new survey jointly carried out by The Manufacturing Institute and PwC (and conducted by Zpryme Research) covering a wide range of timely issues surrounding the smart factory and smart products. The survey can be found via this link: https://www.surveymonkey.com/r/KVQHT8P. Thanks for completing this survey and/or for passing it along to those in your organization for whom it might be a good fit.
|
|
Thank you for subscribing to the NAM’s Monday Economic Report.
If you’re part of an NAM member company and not yet subscribed, email us. If you’re not an NAM member, become one today!
|
|
|
|
|
|
|
|
|
|
|

