 |
| If you’re having trouble reading this, click here. |
|
| MONDAY ECONOMIC REPORT |
|
|
|
|
| Essential Takes on Leading Economic Indicators |
|
By Chad Moutray, Ph.D., CBE – April 8, 2019 – SHARE


|
|
<
|
|
|
Manufacturing Hiring Fell in March |
|
| The Weekly Toplines |
|
- Manufacturing employment fell by 6,000 workers in March, the first monthly decline in hiring in the sector since July 2017. It was the second straight month of disappointing hiring numbers, with just 1,000 employees added in February.
- Yet, even with weaker-than-desired hiring over the past two months, manufacturers have added 18,400 workers per month since the end of 2017, a solid rate overall. Indeed, firms continue to cite a difficulty in obtaining talent as a top concern, and there is an expectation that job growth will rebound to healthy paces in the months ahead.
- In the larger economy, nonfarm payrolls increased by 196,000 workers in March, bouncing back from a disappointing February, which added just 33,000 employees. The unemployment rate remained at 3.8 percent in March, continuing to be near 50-year lows.
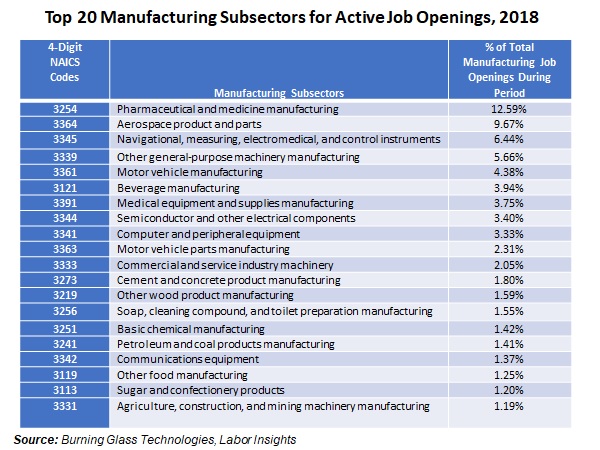
- A new paper uses Burning Glass Technologies data to identify where the open positions in manufacturing occurred in 2018, including the top sectors and states. Overall, this analysis highlights that the top jobs are highly technical, likely requiring specialized skills training and credentials and showcasing just how “modern” manufacturing has become.
- The Institute for Supply Management® reported that manufacturing activity bounced back from the lowest point since November 2016 to reflect continued modest expansions in the sector, with the ISM® Manufacturing Purchasing Managers’ Index® up from 54.2 in February to 55.3 in March. Overall, manufacturers cited stronger growth in March—especially relative to the softer data in December.
- New durable goods orders fell 1.6 percent in February—weakening after rising 0.1 percent in January—largely on declines in nondefense aircraft and parts sales. Excluding transportation, new durable goods orders edged up 0.1 percent for the month. Over the past 12 months, new durable goods orders excluding transportation and core capital goods orders have risen 3.3 percent and 2.5 percent year-over-year, respectively.
- Private manufacturing construction spending increased 0.9 percent in the latest data, up from $66.03 billion at the annual rate in January to $66.61 billion in February. After falling to the lowest level since September 2014 in May ($60.77 billion), construction activity has trended higher since then, which has been welcome news.
Retail sales declined 0.2 percent in February, continuing to reflect softer consumer spending than desired since the end of last year. On the other hand, January retail sales were revised higher, up 0.7 percent instead of the original estimate of a 0.2 percent gain. The weaker data over the past two months suggests that Americans have been more cautious in their spending, but sales are still expected to rebound moving forward.
|
 |
|
| Economic Indicators |
|
Last Week's Indicators:
(Summaries Appear Below)
Monday, April 1
Construction Spending
ISM® Manufacturing Purchasing Managers’ Index®
Retail Sales
Tuesday, April 2
Durable Goods Orders and Shipments
Wednesday, April 3
ADP National Employment Report
Thursday, April 4
None
Friday, April 5
BLS National Employment Report
|
|
|
|
This Week's Indicators:
Monday, April 8
Factory Orders and Shipments
Tuesday, April 9
Job Openings and Labor Turnover Survey
NFIB Small Business Survey
Wednesday, April 10
Consumer Price Index
Thursday, April 11
Producer Price Index
Friday, April 12
University of Michigan Consumer Sentiment
|
|
|
| Deeper Dive |
|
- ADP National Employment Report: Manufacturers lost 2,000 workers in March, according to ADP estimates, the first monthly decrease in employment in the sector since December 2016. Even with the weak figure in March, the manufacturing sector has added 39,000 workers in the first quarter of 2019, with nearly 15,000 jobs created over the past 12 months. Meanwhile, total nonfarm private employment was also softer than desired, up by 129,000 in March, the weakest monthly growth since September 2017 and down from 197,000 in February. The labor market has grown robustly overall, with nearly 211,000 employees generated per month on average over the past 12 months. More than 53 percent of the net new jobs created in March came from small and medium-sized businesses.
- BLS National Employment Report: Manufacturing employment fell by 6,000 workers in March, the first monthly decline in hiring in the sector since July 2017. It was the second straight month of disappointing hiring numbers, with just 1,000 employees added in February. In the March data, notable softness occurred in the chemicals, motor vehicles and parts, nonmetallic mineral products, plastics and rubber products and wood products sectors, among others. Yet, even with weaker-than-desired hiring over the past two months, manufacturers have added 18,400 workers per month since the end of 2017, a solid rate overall. Indeed, firms continue to cite a difficulty in obtaining talent as a top concern, and there is an expectation that job growth will rebound to healthy paces in the months ahead.
In the larger economy, nonfarm payrolls increased by 196,000 workers in March, bouncing back from a disappointing February, which added just 33,000 employees. Overall, the labor market remains extremely tight, with the U.S. economy generating nearly 215,000 workers per month over the past five quarters. The unemployment rate remained at 3.8 percent in March, continuing to be near 50-year lows, and the so-called “real unemployment rate” stayed at 7.3 percent in this report, matching February’s rate, which was the lowest since March 2001.
- Construction Spending: Private manufacturing construction spending increased 0.9 percent in the latest data, up from $66.03 billion at the annual rate in January to $66.61 billion in February. After falling to the lowest level since September 2014 in May ($60.77 billion), construction activity has trended higher since then, which has been welcome news. This upward trend has been consistent largely with the stronger economic outlook. Along those lines, the value of construction put in place in manufacturing has risen 3.4 percent from one year ago, with $64.45 billion in construction spending in the sector in February 2018. Nonetheless, construction in the sector remains well below the all-time high of $82.1 billion in May 2015.
Meanwhile, total construction spending rose 1.0 percent in February, with private and public sector spending up 0.2 percent and 3.6 percent, respectively. At the same time, private-sector nonresidential construction fell 0.5 percent in February, eking out a gain of just 0.1 percent over the past 12 months.
- Durable Goods Orders and Shipments: New durable goods orders fell 1.6 percent in February, weakening after rising 0.1 percent in January. With that said, nondefense aircraft and parts orders, which can be highly volatile from month to month, declined 31.1 percent in February. Excluding transportation, new durable goods orders edged up 0.1 percent for the month. That is a soft figure, with drags from sales of computers and electronic products, machinery and motor vehicles and parts. As a result, new orders for core capital goods (or nondefense capital goods excluding aircraft)—a proxy for capital spending in the U.S. economy—inched down 0.1 percent in February to $68.9 billion. Nonetheless, core capital goods spending has drifted somewhat lower since reaching an all-time high in July ($69.9 billion).
The longer-term trend reflects modest growth. New durable goods orders have increased 1.8 percent over the past 12 months, with new orders excluding transportation equipment and core capital goods orders up 3.3 percent and 2.5 percent year-over-year, respectively. Meanwhile, durable goods shipments rose 0.2 percent in February. Since February 2018, durable goods shipments have risen a healthy 5.5 percent.
- ISM® Manufacturing Purchasing Managers’ Index®: The Institute for Supply Management® reported that manufacturing activity bounced back from the lowest point since November 2016 to reflect continued modest expansions in the sector. The composite index rose from 54.2 in February to 55.3 in March, with improved new orders, production and employment data for the month. Exports slowed somewhat in March but remained slightly positive. Pricing pressures picked up in the latest survey after falling in February’s figures. Overall, manufacturers cited stronger growth in March—especially relative to the softer data in December—and noted tight labor markets as a lingering challenge. Respondents expressed trade anxieties and uncertainties surrounding Brexit as concerns for them.
- Retail Sales: Consumer spending declined 0.2 percent in February, continuing to reflect softer retail sales than desired since the end of last year. On the other hand, January retail sales were revised higher, up 0.7 percent instead of the original estimate of a 0.2 percent gain. While a rebound might be expected moving forward, the fact that the data remain weak (and were not limited to just a month or two) suggests that Americans are cautious in their spending right now. Over the past 12 months, retail sales have risen a modest 2.2 percent year-over-year, down from 2.8 percent in January. As recently as November, the year-over-year rate registered 4.0 percent.
In February, gasoline stations, nonstore retailers, motor vehicle and parts dealers, health and personal care stores and sporting goods and hobby stores had the largest monthly gains in retail sales, with gasoline station spending positively impacted by higher prices. Suggesting broader weaknesses in core spending for the month, retail sales excluding automobiles and gasoline declined 0.6 percent in February, with 2.9 percent growth year-over-year.
|
|
|
Thank you for subscribing to the NAM’s Monday Economic Report.
If you’re part of an NAM member company and not yet subscribed, email us. If you’re not an NAM member, become one today!
|
|
|
|
|
|
|
|
|
|
|

