 |
| If you're having trouble reading this, click here. |
|
| MONDAY ECONOMIC REPORT |
|
|
|
|
| Essential Takes on Leading Economic Indicators |
|
By Chad Moutray, Ph.D., CBE - June 3, 2019 - SHARE


|
|
<
|
|
|
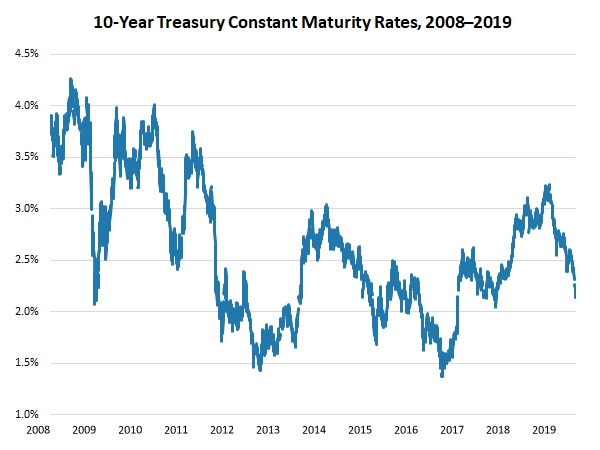
10-Year Treasury Bond Yields Fall to Lowest Rates Since August 2017 |
|
| The Weekly Toplines |
|
- Slowing global growth and ongoing trade policy uncertainties pushed interest rates lower last week, with yields on 10-year Treasury bonds falling to 2.13 percent on Friday, the lowest rate since August 2017. Moreover, it is a full percentage point lower than seven months ago. Similarly, the average 30-year fixed mortgage rate fell to 3.99 percent last week, the first sub-4 percent reading since January 2018.
- Much has also been made of the inversion of several yield curves, including the spread between the 10-year Treasury bond and the three-month Treasury bill. Yet, the spread between 10-year and two-year Treasury bonds remains (slightly) positive, and it has only been a predictor of a downturn when negative. It is important to keep in mind that yield curves might not have the same predictive power as in the past, and while they can be an important signal of financial market perceptions, I continue to feel that the economy is slowing, not receding, at least not yet.
- In fact, despite a multitude of challenges--slowing global growth, the partial government shutdown, trade policy uncertainties, a strong U.S. dollar--the U.S. economy grew a solid 3.1 percent at the annual rate in the first quarter. This was off slightly from the previous estimate of 3.2 percent growth, and it remained the strongest first quarter of growth since 2015.
- Moving forward, the U.S. economy is expected to expand by around 2.2 percent in the second quarter, slowing from the pace at the beginning of the year. The current estimate is for 2.5 percent growth for 2019.
- Manufacturing surveys from the Dallas and Richmond Federal Reserve Banks continued to indicate expansions in their districts, even as sentiment dipped into negative territory in the Texas report. Hiring and capital spending were encouraging in both releases, and as with other regional Federal Reserve surveys, respondents remained positive in their outlook.
- Consumer sentiment was stronger in May and solid overall, according to the University of Michigan and Thomson Reuters, but dipped from preliminary estimates due to tariff concerns.
- Personal consumption expenditures rose 0.3 percent in April, slowing after jumping 1.1 percent in March. Over the past 12 months, personal spending has risen 4.3 percent, and Americans have continued to open their pocketbooks, especially relative to the softer spending pace at year's end. The saving rate declined from 7.4 percent in December to 6.2 percent in April. Meanwhile, personal income increased strongly, up 0.5 percent in April and 3.9 percent year-over-year.
- The PCE deflator rose 0.3 percent in April, buoyed by higher energy costs. At the same time, the core PCE deflator, which excludes food and energy prices, rose 0.2 percent in April. Over the past 12 months, the PCE deflator has risen 1.5 percent. In general, core inflation has moderated substantially from last year, with the core PCE deflator up 2.4 percent year-over-year in July 2018. In addition, this measure remains well below the Federal Reserve's stated goal of 2 percent core inflation.
- As such, the pricing data should provide some comfort to the Federal Open Market Committee, as it allows participants the luxury of being more "dovish" in setting monetary policy over the coming months.
|
 |
|
| Economic Indicators |
|
Last Week's Indicators:
(Summaries Appear Below)
Monday, May 27
MEMORIAL DAY HOLIDAY
Tuesday, May 28
Conference Board Consumer Confidence
Dallas Fed Manufacturing Survey
Wednesday, May 29
Richmond Fed Manufacturing Survey
Thursday, May 30
Gross Domestic Product (Revision)
International Trade in Goods (Preliminary)
Friday, May 31
Personal Consumption Expenditures Deflator
Personal Income and Spending
University of Michigan Consumer Sentiment |
|
|
|
This Week's Indicators:
Monday, June 3
Construction Spending
ISM Manufacturing Purchasing Managers' Index
Tuesday, June 4
Factory Orders and Shipments
Wednesday, June 5
ADP National Employment Report
Thursday, June 6
International Trade Report
Productivity and Costs (Revision)
Friday, June 7
BLS National Employment Report |
|
|
| Deeper Dive |
|
- Conference Board Consumer Confidence: Consumer sentiment jumped from 129.2 in April to 134.1 in May, remaining highly elevated and the best reading since November. As such, confidence was not far from 18-year highs, according to the Conference Board, buoyed by improved perceptions about both current and future economic conditions. In the latest data, the percentage of respondents suggesting that business conditions were "good" increased from 37.6 percent to 38.3 percent, with those noting that conditions were "bad" declining from 11.3 percent to 10.2 percent. Moreover, the percentage of Americans feeling that jobs were "plentiful" increased from 46.5 percent to 47.2 percent, with those responding that jobs were "hard to get" dropping from 13.3 percent to 10.9 percent.
- Dallas Fed Manufacturing Survey: While manufacturing new orders and production grew at slower rates in May, the composite index of general business activity fell from 2.0 in April to -5.3 in May, declining for the first time since January. With that said, shipments and employment improved somewhat in May, and capital spending continued to expand at a healthy pace, albeit with a slight pullback. Overall, manufacturers in the Texas district remained positive about the next six months, but with some easing from the prior survey. Indeed, 47.0 percent of respondents predict more sales over the coming months, with 37.9 percent and 30.4 percent anticipating more hiring and capital spending, respectively.
In special questions, manufacturers predict wages to rise 3.9 percent in 2019, with input costs (excluding wages) up 3.1 percent for the year. To recruit and retain employees, two-thirds said they are increasing wages and/or benefits, and 54.3 percent are intensifying their recruiting efforts.
- Gross Domestic Product (Revision): Despite a multitude of challenges--slowing global growth, the partial government shutdown, trade policy uncertainties, a strong U.S. dollar--the U.S. economy grew a solid 3.1 percent at the annual rate in the first quarter. This was off slightly from the previous estimate of 3.2 percent growth, and it remained the strongest first quarter of growth since 2015. The slight downward revision stemmed largely from lower estimates to nonresidential fixed investment and inventory spending.
Overall, the data were buoyed by robust contributions from service-sector consumption, exports and state and local government spending, with notable drags on growth from durable goods spending and housing. Weaker consumer purchases stemmed largely from sharp declines in motor vehicles and parts activity, among other categories.
Moving forward, the U.S. economy is expected to expand by around 2.2 percent in the second quarter, slowing from the pace at the beginning of the year. The current estimate is for 2.5 percent growth for 2019.
In the first quarter figures, goods consumption declined 0.3 percent at the annual rate, weighed down by a whopping 4.6 percent decrease in durable goods spending (see the motor vehicles discussion above) but helped by a 2.0 percent increase for nondurable goods activity. At the same time, nonresidential fixed investment rose a modest 2.3 percent, largely on intellectual property spending. Equipment and structures investment was softer than desired, but business spending on inventories added 0.60 percentage points to headline growth.
Meanwhile, goods exports rose an annualized 6.3 percent in the first quarter, with goods imports off 3.1 percent. Therefore, net exports added 0.96 percentage points to real GDP growth, the strongest contribution since the second quarter of 2018.
- International Trade in Goods (Preliminary): In advance statistics, the goods trade deficit increased from $71.87 billion in March to $72.12 billion in April. The data were highly volatile for the month, with declines in both goods exports and goods imports that nearly offset one another. The largest decreases in goods exports in April occurred in capital goods and automotive vehicles. Final data will be released June 6, which will also include the service-sector trade surplus.
- Personal Consumption Expenditures Deflator: The PCE deflator rose 0.3 percent in April, picking up slightly from a gain of 0.2 percent in March, largely on higher energy costs, up 2.9 percent for the month. At the same time, the core PCE deflator, which excludes food and energy prices, rose 0.2 percent in April. Over the past 12 months, the PCE deflator has risen 1.5 percent, up from 1.3 percent in January and February and 1.4 percent in March. Yet, while core inflation has accelerated a little in the past few months, pricing pressures have moderated substantially from last year, with the core PCE deflator up 2.4 percent year-over-year in July 2018. In addition, this measure remains well below the Federal Reserve's stated goal of 2 percent core inflation.
As such, the pricing data should provide some comfort to the Federal Open Market Committee, as it allows participants the luxury of being more "dovish" in setting monetary policy over the coming months.
- Personal Income and Spending: Personal consumption expenditures rose 0.3 percent in April, slowing after jumping 1.1 percent in March. Nondurable goods spending increased 0.7 percent in April, but that was offset somewhat by a decline of 0.8 percent for durable goods purchases. Encouragingly, personal spending has risen 4.3 percent year-over-year, a decent pace overall even as it inched down from 4.5 percent in the prior report. Overall, Americans have continued to open their pocketbooks, especially relative to the softer spending pace at year's end. The saving rate is more evidence of this, with the rate falling from 7.4 percent in December to 6.2 percent in April. With that said, the saving rate edged up from 6.1 percent in March.
Meanwhile, personal income increased strongly, up 0.5 percent in April, the strongest monthly rate of growth so far in 2019. Over the past 12 months, personal income has risen 3.9 percent since April 2018, up from 3.6 percent year-over-year in March.
- Richmond Fed Manufacturing Survey: Manufacturing activity expanded modestly for the fourth straight month in the district in May. The composite index of general business activity inched up from 3 in April to 5 in May, with some stabilization in new orders and shipments after slight declines in April. However, capacity utilization remained negative. More encouragingly, manufacturers in the region continue to invest in their companies, with healthy increases in employment and capital spending. The index for wages (up from 25 to 38) registered the highest reading since the question was added in 1997, highlighting the tightness of the labor market and with firms once again citing an inability to find sufficient talent. Moreover, survey respondents remained optimistic about further expansion over the next six months.
Raw material costs rose 2.21 percent at the annual rate in May, the lowest level since February 2018 and down from 3.04 percent in April. This suggests some moderation in input costs, which is welcome news. Moving forward, manufacturers see raw material prices rising an annualized 2.47 percent six months from now, edging slightly higher from 2.45 percent in April.
- University of Michigan Consumer Sentiment: The Index of Consumer Sentiment pulled higher in the latest survey, up from 97.2 in April to 100.0 in May. Yet, this reflected some easing from preliminary data, which had the May reading at 102.4. The revision from the earlier estimate was due to trade policy uncertainty, according to the University of Michigan and Thomson Reuters. Overall, Americans felt more upbeat in their economic outlook, helping to boost the headline index, but they were less upbeat about current economic conditions.
|
|
| Take Action |
|
If you have not already done so, please take a moment to complete the latest NAM Manufacturers' Outlook Survey. This 22-question survey will help us gauge how manufacturing sentiment has changed since the first quarter survey, which continued to show highly elevated levels of confidence and expected activity among respondents. The survey includes special questions on trade uncertainties, infrastructure, immigration and tax reform. To complete the survey, click here. Responses are due by Wednesday, June 5, at 5:00 p.m. EDT. As always, all responses are anonymous. |
|
|
Thank you for subscribing to the NAM's Monday Economic Report.
If you're part of an NAM member company and not yet subscribed, email us. If you're not an NAM member, become one today!
|
|
|
|
|
|
|
|
|
|
| Interested in becoming a presenter of the Monday Economic Report? Email us. |
|
| Questions or comments? Email NAM Chief Economist Chad Moutray at [email protected]. |
|
|
 |
|
|
|
|
|
|
|
|
