 |
| If you're having trouble reading this, click here. |
|
| MONDAY ECONOMIC REPORT |
|
|
|
| Essential Takes on Leading Economic Indicators |
|
By Chad Moutray, Ph.D., CBE – July 22, 2019 – SHARE    |
|
|
|
|
| Manufacturing Production Rebounded for the Second Straight Month in June |
|
| The Weekly Toplines |
|
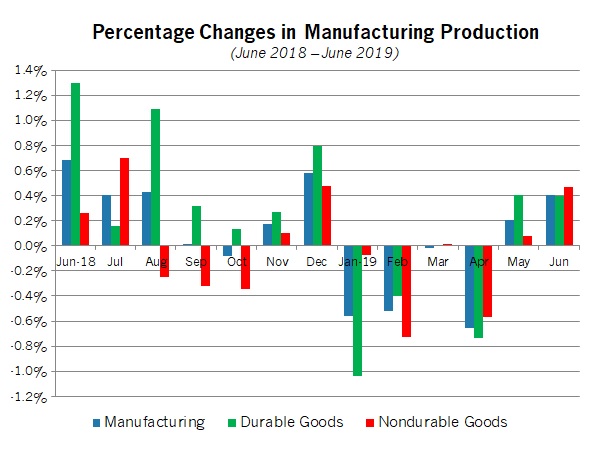
- Manufacturing production rebounded for the second straight month, showing signs of stabilization after declining in each of the first four months of 2019 (March data were “unchanged,” but marginally negative). Output in the sector increased 0.4 percent in June, extending the 0.2 percent gain in May. Durable and nondurable goods production rose 0.4 percent and 0.5 percent, respectively, for the month, led by strong growth for computer and electronic products, motor vehicles and parts, nonmetallic mineral products and petroleum and coal products, among others.
- Yet, the data also reflect the toll from slowing global activity and trade uncertainties year to date. In fact, manufacturing production has risen just 0.4 percent over the past 12 months. That represents a sharp deceleration from the 3.5 percent year-over-year pace in September. Likewise, manufacturing capacity utilization rose from 75.6 percent in May to 75.9 percent in June, a three-month high, but capacity has also eased from 77.3 percent in December, which was the best reading since March 2008.
- Manufacturing activity also bounced back in the New York and Philadelphia Federal Reserve Bank districts. However, the Empire State Manufacturing Survey continued to reflect weaknesses in demand and hiring. Looking ahead six months, respondents to both surveys remained upbeat in their outlook, but pricing pressures were expected to pick up somewhat.
- Retail spending continued to strengthen, rising 0.4 percent for the third straight month in June. Overall, Americans accelerated their spending in the second quarter after being more hesitant in their purchasing in the first quarter. Over the past 12 months, retail sales have risen a modest 3.4 percent, or 3.8 percent year-over-year with motor vehicles and gasoline station sales excluded.
- New housing starts declined 0.9 percent, down from an annualized 1,265,000 units in May to 1,253,000 units in June. The housing market remains softer than desired despite reduced mortgage rates. Over the past 12 months, housing starts have risen 6.2 percent, up from 1,180,000 units in June 2018. However, single-family starts fell 0.8 percent, highlighting weaknesses in that all-important segment, especially in the Northeast and West.
- While builders feel upbeat about sales over the next six months despite affordability and workforce challenges, housing permits—a proxy of future activity—dropped 6.1 percent in the latest report, led by a sharp decline in multifamily permitting, which can be highly volatile from month to month. On the other hand, permits for single-family units were higher.
- Manufacturing value-added output edged up from $2.3845 trillion in the fourth quarter to $2.3852 trillion in the first quarter, eking out another all-time high. In addition, in chained 2012 dollars, real value-added output also set a new record, up from $2.155 trillion in the fourth quarter to $2.178 trillion in the first quarter. Manufacturing accounted for 11.3 percent of real GDP in the first quarter.
|
 |
|
| Economic Indicators |
|
Last Week's Indicators:
(Summaries Appear Below)
Monday, July 15
New York Fed Manufacturing Survey
Tuesday, July 16
Industrial Production
NAHB Housing Market Index
Retail Sales
Wednesday, July 17
Housing Starts and Permits
Thursday, July 18
Conference Board Leading Indicators
Philadelphia Fed Manufacturing Survey
Friday, July 19
Gross Domestic Product by Industry
State Employment Report
University of Michigan Consumer Sentiment |
|
|
|
This Week's Indicators:
Monday, July 22
Chicago Fed National Activity Index
Tuesday, July 23
Existing Home Sales
Richmond Fed Manufacturing Survey
Wednesday, July 24
Business Employment Dynamics
IHS Markit Flash U.S. Manufacturing PMI
New Home Sales
Thursday, July 25
Durable Goods Orders and Shipments
International Trade in Goods (Preliminary)
Kansas City Fed Manufacturing Survey
Friday, July 26
Gross Domestic Product (Second Quarter) |
|
|
| Deeper Dive |
|
- Conference Board Leading Indicators: The Leading Economic Index fell 0.3 percent in June, the first decline year to date. Reduced new orders in the manufacturing sector and weaknesses in building permits, the interest rate spread and average unemployment claims pulled the data lower. These were somewhat counterbalanced by strengths in consumer confidence, the average employee workweek, lending conditions and stock prices. Meanwhile, the Coincident Economic Index edged up 0.1 percent in June, slowing from a gain of 0.2 percent in May. Industrial production, which was flat in June (see below), provided a slight drag on the CEI for the month, but manufacturing and trade sales, nonfarm payrolls and personal income continued to be bright spots in the economic data.
- Gross Domestic Product by Industry: Real GDP grew 3.1 percent at the annual rate in the first quarter, as previously reported. According to new data from the Bureau of Economic Analysis, manufacturing added 0.51 percentage points to top-line growth in the first quarter.
Overall, manufacturing value-added output edged up from $2.3845 trillion in the fourth quarter to $2.3852 trillion in the first quarter, eking out another all-time high. This was led by strength in value-added output for durable goods, which rose from $1.329 trillion to $1.345 trillion, a new record, but this was mostly offset by a reduction for nondurable goods, down from $1.056 trillion to $1.041 trillion. The bottom line is that manufacturing accounted for 11.3 percent of real GDP in the first quarter, down from 11.4 percent in the prior quarter.
Adjusting for inflation, a new all-time high also occurred for real value-added output in manufacturing, up from $2.155 trillion in the fourth quarter to $2.178 trillion in the first quarter, with increases for both durable and nondurable goods. Those figures are in chained 2012 dollars. Despite those new records, manufacturing gross output pulled back from an all-time high of $6.360 trillion in the fourth quarter to $6.301 trillion in the first quarter, mainly from a sizable drop in gross output for nondurable goods. Gross output for durable goods reached a new high at $3.281 trillion.
- Housing Starts and Permits: New residential construction declined 0.9 percent, down from an annualized 1,265,000 units in May to 1,253,000 units in June. The underlying data provided mixed results, with single-family starts higher (up from 818,000 to 847,000) but multifamily activity lower (down from 447,000 to 406,000). Overall, the data suggest that the housing market remains softer than desired despite reduced mortgage rates. Over the past 12 months, housing starts have risen 6.2 percent, up from 1,180,000 units in June 2018. However, single-family starts fell 0.8 percent, highlighting weaknesses in that all-important segment, especially in the Northeast and West.
While builders feel upbeat about sales over the next six months (see below) despite affordability and workforce challenges, housing permits—a proxy of future activity—dropped 6.1 percent in the latest report. Permits decreased from 1,299,000 units at the annual rate in May to 1,220,000 units in June, largely on sharply lower multifamily permits, down from 489,000 to 407,000 units, which can be highly volatile from month to month. Single-family permitting, on the other hand, edged up from 810,000 to 813,000 units. New residential permitting declined 6.6 percent year-over-year, down from 1,306,000 units in June 2018, with single-family permits off 4.7 percent.
- Industrial Production: Manufacturing production rebounded for the second straight month, showing signs of stabilization after declining in each of the first four months of 2019 (March data were “unchanged,” but marginally negative). Output in the sector increased 0.4 percent in June, extending the 0.2 percent gain in May. Durable and nondurable goods production rose 0.4 percent and 0.5 percent, respectively, for the month, led by strong growth for computer and electronic products, motor vehicles and parts, nonmetallic mineral products and petroleum and coal products, among others.
Yet, the data also reflect the toll from slowing global activity and trade uncertainties year to date. In fact, manufacturing production has risen just 0.4 percent over the past 12 months. That represents a sharp deceleration from the 3.5 percent year-over-year pace in September. Likewise, manufacturing capacity utilization rose from 75.6 percent in May to 75.9 percent in June, a three-month high, but capacity has also eased from 77.3 percent in December, which was the best reading since March 2008.
Meanwhile, total industrial production was unchanged in June after rising 0.4 percent in May. Improved output for manufacturing and mining (up 0.2 percent) was offset by weaker production in the utilities sector, which fell 3.6 percent. Over the past 12 months, industrial production has risen 1.3 percent, continuing to reflect deceleration from the recent peak, a robust 5.4 percent in September. Total capacity utilization edged down from 78.1 percent to 77.9 percent for the month.
- NAHB Housing Market Index: The National Association of Home Builders and Wells Fargo reported that confidence edged higher in July. The Housing Market Index rose from 64 in June to 65 in July. Overall, builders continue to feel optimistic, especially with reduced mortgage rates, which should boost demand. Indeed, the index for expected single-family sales six months from now inched up from 70 to 71—a figure that suggests robust growth over the coming months. Yet, the NAHB also notes ongoing challenges, especially with the lack of skilled labor and rising costs that hurt affordability for would-be homebuyers. On that score, it is important to note that the HMI was 68 one year ago.
- New York Fed Manufacturing Survey: Manufacturing activity in the New York Federal Reserve Bank’s district rebounded in July after contracting in June for the first time since October 2016. The headline index rose from -8.6 in June to 4.3 in July, with shipments and the average employee workweek expanding modestly for the month. Nonetheless, new orders and employment remained negative, with hiring declining for the second straight month and with the weakest reading since January 2016.
At the same time, respondents to the Empire State Manufacturing Survey remain optimistic in their outlook for the next six months. Half of those completing the survey anticipate higher sales over the coming months, and 23.5 percent and 30.7 percent predict more hiring and capital expenditures, respectively. Meanwhile, raw material costs accelerated in July and are expected to remain somewhat elevated moving forward, even as the pace of growth has decelerated from the sharp rises seen last year.
- Philadelphia Fed Manufacturing Survey: Manufacturing activity rebounded strongly in July, expanding for the fifth straight month. The composite index of general business activity jumped from 0.3 in June to 21.8 in July, the best reading in 12 months and led by healthy growth across the board. This includes accelerating new orders, shipments, employment and the average employee workweek.
More importantly, manufacturers in the district remain optimistic in their outlook for the next six months, with the forward-looking composite index up from 21.4 to 38.0, the strongest figure since May 2018. Roughly 60 percent of respondents expect new orders and shipments to rise in the coming months, with 34.0 percent and 43.1 percent anticipating increased hiring and capital spending, respectively. At the same time, anticipated pricing pressures picked up somewhat, with 41.6 percent of manufacturers seeing input costs rising over the next six months, up from 38.3 percent in the prior survey.
- Retail Sales: Consumer spending continued to strengthen, rising 0.4 percent for the third straight month in June. More importantly, retail spending increased 0.7 percent in June with gasoline station sales excluded, with falling prices pushing that category down 2.8 percent. Overall, the data suggest that Americans accelerated their spending in the second quarter after being more hesitant in their purchasing in the first quarter. Over the past 12 months, retail sales have risen a modest 3.4 percent, or 3.8 percent year-over-year with motor vehicles and gasoline station sales excluded.
The largest increases in retail sales for the month occurred for food services and drinking places, motor vehicles and parts dealers and nonstore retailers, among others. In contrast, sales decreased for department stores, electronics and appliances stores and gasoline stations. Once again, the structural shift toward online spending can be seen clearly, with sales for nonstore retailers jumping 13.4 percent since June 2018 but department store sales down 5.2 percent year-over-year.
- State Employment Report: Tennessee created the most net new manufacturing jobs in June, adding 3,100 workers, with Texas (up 2,100), Iowa (up 2,000), Michigan (up 2,000), California (up 1,500) and Maryland (up 1,500) close behind. In addition, Texas saw the greatest job gains in the sector over the past 12 months, with manufacturing employment in the state up 25,800 since June 2018. Other states with the fastest manufacturing job growth year-over-year included California (up 11,800), Washington (up 11,800), Florida (up 10,500), Tennessee (up 8,300) and Iowa (up 8,100). Meanwhile, Vermont had the lowest unemployment rate in the nation in June, remaining at 2.1 percent.
- University of Michigan Consumer Sentiment: The Index of Consumer Sentiment inched up from 98.2 in June to 98.4 in July in preliminary data, according to the University of Michigan and Thomson Reuters. Americans felt slightly less upbeat about current conditions, but the headline index rose on an improved outlook for the coming months. Final data will be released on August 2.
|
|
| Take Action |
|
- The Manufacturing Institute, the education and workforce partner of the NAM, recently completed a study on retaining and upskilling aging members of the manufacturing workforce in partnership with the Alfred P. Sloan Foundation. This is of particular interest to employers with a workforce near retirement age, especially in a tight labor market. Please join me on July 31 for the report launch at the NAM from 11:45 a.m. to 2:00 p.m., including lunch. To register, click here.
|
|
Thank you for subscribing to the NAM's Monday Economic Report.
If you're part of an NAM member company and not yet subscribed, email us. If you're not an NAM member, become one today! |
|
|
|
|
|
|
|
|
|
|
|
|
|
|
|
|

