 |
| If you’re having trouble reading this, click here. |
|
| MONDAY ECONOMIC REPORT |
|
|
|
|
| Essential Takes on Leading Economic Indicators |
|
By Chad Moutray, Ph.D., CBE – August 12, 2019 – SHARE


|
|
<
|
|
|
| Economic Worries Rock Financial Markets Globally |
|
| The Weekly Toplines |
|
- Worries about a global economic slowdown—which has been exacerbated by renewed trade uncertainties—has caused financial markets to fall dramatically. These trends were outlined in this month’s Global Manufacturing Economic Update, which was released last week.
- Since that release, continuing signs of weakness arose in Europe. German industrial production fell 1.5 percent in June, declining for the second time in the past three months and down a whopping 5.1 percent year-over-year. At the same time, real GDP in the United Kingdom decreased 0.2 percent in the second quarter, the first decline in activity since the fourth quarter of 2012, largely on Brexit concerns, with 1.2 percent growth year-over-year.
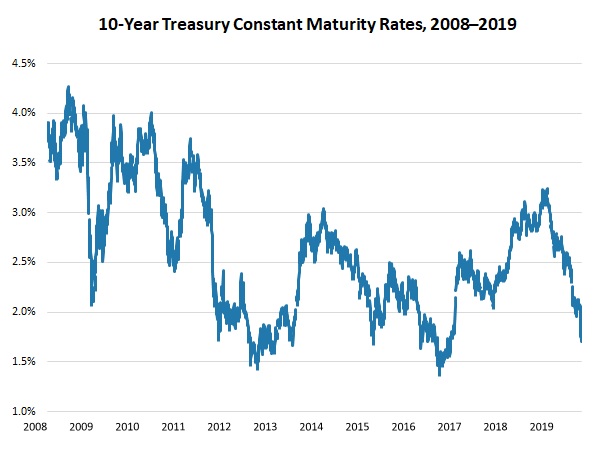
- Anxieties about the global outlook have rocked financial markets globally. In the United States, the Dow Jones Industrial Average has more than 4 percent since July 15. To be fair, that was better than what was seen midweek. In addition, yields on 10-year Treasury notes have dropped sharply to the lowest rates since October 2016, falling 150 basis points since November 2018.
- Producer prices for final demand goods and services rose 0.2 percent in July, increasing 1.7 percent over the past 12 months, but down dramatically from 3.4 percent in July 2018. In addition, core producer prices have grown 1.7 percent, down from 2.1 percent in June and at their lowest level since January 2017. These data continue to reflect a deceleration of inflationary pressures over the course of the past year.
- The easing in producer price growth has provided some comfort to the Federal Reserve, particularly as it explores additional rate cuts in the coming months, perhaps as soon as the next meeting on September 17–18. Indeed, it is looking increasingly likely that the Federal Open Market Committee will cut short-term rates again next month, extending the 25 basis point cut made at its July 30–31 meeting.
- On a more encouraging front, job openings in the manufacturing sector were unchanged at 503,000 in June, continuing to be an all-time high. Over the past 12 months, job openings have averaged nearly 483,000 per month—a highly elevated pace. With that said, the pace of hiring and separations slowed in June, mirroring other economic activity and employment data.
- Meanwhile, nonfarm job openings changed little for the month, down from 7,384,000 in May to 7,348,000 in June. More importantly, for the 16th straight month, the U.S. economy reported more job openings in the U.S. economy than the number of people looking for work (5,975,000 in June). That statistic suggests there were roughly 1.4 million more job postings than there were unemployed people to fill them.
|
 |
|
| Economic Indicators |
|
Last Week's Indicators:
(Summaries Appear Below)
Monday, August 5
None
Tuesday, August 6
Job Openings and Labor Turnover Survey
Wednesday, August 7
Consumer Credit
Thursday, August 8
None
Friday, August 9
Producer Price Index
|
|
|
|
This Week's Indicators:
Monday, August 12
None
Tuesday, August 13
Consumer Price Index
NFIB Small Business Survey
Wednesday, August 14
None
Thursday, August 15
Industrial Production
NAHB Housing Market Index
New York Fed Manufacturing Survey
Philadelphia Fed Manufacturing Survey
Productivity and Costs
Friday, August 16
Housing Starts and Permits
State Employment Report
University of Michigan Consumer Sentiment
|
|
|
| Deeper Dive |
|
- Consumer Credit: U.S. consumer credit outstanding increased 4.3 percent in June, slowing from 5.2 percent gains in both April and May. Total consumer credit registered $4.102 trillion in June, with $1.072 trillion in revolving credit and $3.031 trillion in nonrevolving credit. Revolving credit (including credit cards and other credit lines) edged down 0.1 percent in June. This suggests Americans were hesitant to incur more credit card debt for the month, possibly slowing consumer spending if that trend continues. In contrast, nonrevolving credit (including auto and student loans) strengthened, up 5.8 percent in June after increasing by 4.1 percent in May.
Over the past 12 months, consumer credit outstanding has risen 5.3 percent, with revolving and nonrevolving credit up 4.6 percent and 5.6 percent year-over-year, respectively.
- Job Openings and Labor Turnover Survey: Job openings in the manufacturing sector were unchanged at 503,000 in June, continuing to be an all-time high. Durable goods job postings edged down from 320,000 in May, the highest level since January 2001 (329,000). Openings in the nondurable goods sector were unchanged at 183,000, which is still the best reading since November. Over the past 12 months, job openings have averaged nearly 483,000 per month—a highly elevated pace. These results echo ongoing concerns about the difficulties of finding talent in the tight labor market, which manufacturers continue to cite as their top challenge in the latest NAM Manufacturers’ Outlook Survey.
With that said, the pace of hiring and separations slowed in June. Hiring in the manufacturing sector eased from 340,000 in May to 324,000 in June. However, separations also decelerated, down from 334,000 to 318,000. As a result, net hiring was 6,000 in June, the same rate as seen in May but well below the net hiring of 28,000 experienced one year ago.
Meanwhile, nonfarm job openings changed little for the month, down from 7,384,000 in May to 7,348,000 in June. More importantly, for the 16th straight month, the U.S. economy reported more job openings than the number of people looking for work (5,975,000 in June). That statistic suggests there were roughly 1.4 million more job postings than there were unemployed people to fill them.
- Producer Price Index: Producer prices for final demand goods and services rose 0.2 percent in July, up from 0.1 percent in both May and June. At the same time, producer prices for final demand goods rebounded, up 0.4 percent in July after two months of declines and led by a jump in energy costs. Core inflation for goods, which excludes food and energy, edged up by 0.1 percent in July following unchanged readings in the three prior months. Meanwhile, producer prices for final demand services inched down by 0.1 percent for the month.
Over the past 12 months, producer prices for final demand goods and services have risen 1.7 percent (seasonally adjusted), up from 1.6 percent year-over-year growth in the previous release, but down dramatically from 3.4 percent in July 2018. In addition, core producer prices have grown 1.7 percent, down from 2.1 percent in June and at their lowest level since January 2017.
Indeed, these data continue to reflect a deceleration of inflationary pressures over the course of the past year. This has been welcome news for manufacturers, many of whom cited challenges with rising input costs last summer as one of their top challenges. In addition, the easing in producer price growth has provided some comfort to the Federal Reserve, particularly as it explores additional rate cuts in the coming months, perhaps as soon as the next meeting on September 17–18.
|
|
|
Thank you for subscribing to the NAM’s Monday Economic Report.
If you’re part of an NAM member company and not yet subscribed, email us. If you’re not an NAM member, become one today!
|
|
|
|
|
|
|
|
|
|
|

