 |
| If you’re having trouble reading this, click here. |
|
| MONDAY ECONOMIC REPORT |
|
|
|
|
| Essential Takes on Leading Economic Indicators |
|
By Chad Moutray, Ph.D., CBE – August 19, 2019 – SHARE


|
|
<
|
|
|
Yield Curve Inversions Spur Economic Outlook Worries |
|
| The Weekly Toplines |
|
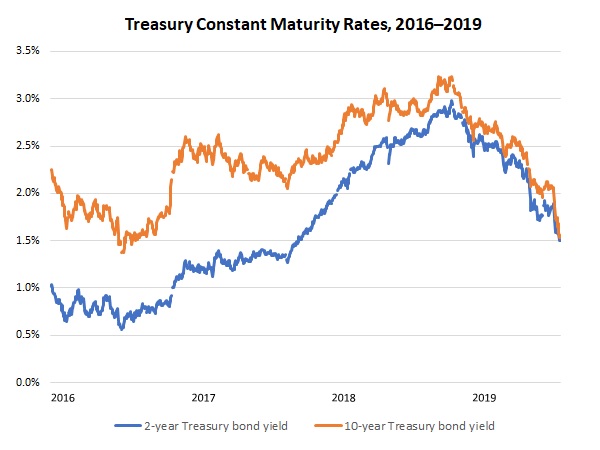
- Last week, the spread between 10-year and 2-year Treasury bond yields inverted briefly for the first time since June 2007. This spread is an important barometer, as it has historically signaled that a recession could begin in 12 to 18 months. Other yield curves around the world have also inverted, and this development created turmoil midweek in financial markets.
- It is important to recognize, however, that the inversion of the yield curve does not necessarily mean that a recession is imminent. The U.S. economy continues to show strength, particularly for consumer spending and in labor markets, and it should grow 2.3 percent in 2019, with 1.8 percent growth forecasted for 2020. Still, the risks of a recession have picked up, rising to around 50 percent over the next 24 months.
- There are warning signs out there. For instance, manufacturing production declined 0.4 percent in July, the fifth decrease in output in the sector year to date, and over the past 12 months, manufacturing production has fallen 0.5 percent. In addition, capacity utilization in the sector has dropped from 77.3 percent in December, the best since March 2008, to 75.4 percent in July.
- Manufacturing labor productivity fell 1.6 percent at the annual rate in the second quarter, the first decline since the first quarter of 2018. It was pulled lower by reduced output for the second straight quarter, down 2.1 percent in the second quarter. In contrast, nonfarm business labor productivity rose 2.3 percent at the annual rate in the second quarter.
- Modest expansions in activity occurred in both the New York and Philadelphia Federal Reserve Bank districts in August, but with hiring growth slowing in both regions. Firms remained upbeat about the next six months, even with input costs expected to rise.
- Retail spending continued to strengthen, up 0.7 percent in July and increasing for the fifth straight month. Overall, Americans have accelerated their spending in recent months after being more hesitant earlier in the year, with retail sales up 3.4 percent year-over-year.
- Nonetheless, consumer sentiment fell in August to the lowest level since January, with Americans more anxious in light of increased trade policy uncertainty and volatility in financial markets.
- Housing starts fell to a five-month low, pulled lower by weakness in the highly volatile multifamily segment. On a more encouraging note, single-family housing starts rose to the best reading since January, and it suggests that reduced mortgage rates, which are the lowest since November 2016, are starting to have an impact.
- In addition, housing permits increased strongly, signaling optimism about future activity. Homebuilders are also confident about single-family sales for the next six months, even as they continue to cite challenges with the skills gap and rising costs.
|
 |
|
| Economic Indicators |
|
Last Week's Indicators:
(Summaries Appear Below)
Monday, August 12
None
Tuesday, August 13
Consumer Price Index
NFIB Small Business Survey
Wednesday, August 14
None
Thursday, August 15
Industrial Production
NAHB Housing Market Index
New York Fed Manufacturing Survey
Philadelphia Fed Manufacturing Survey
Productivity and Costs
Retail Sales
Friday, August 16
Housing Starts and Permits
State Employment Report
University of Michigan Consumer Sentiment
|
|
|
|
This Week's Indicators:
Monday, August 19
None
Tuesday, August 20
None
Wednesday, August 21
Existing Home Sales
Thursday, August 22
Conference Board Leading Indicators
IHS Markit Flash U.S. Manufacturing PMI
Kansas City Fed Manufacturing Survey
Friday, August 23
New Home Sales |
|
|
| Deeper Dive |
|
- Consumer Price Index: Consumer prices rose 0.3 percent in July, accelerating from the 0.1 percent gains in May and June. Higher energy costs, which increased 1.3 percent in July, helped to boost inflationary pressures for consumers for the month, with food prices flat for the second straight report. Over the past 12 months, the consumer price index has risen 1.8 percent, up from 1.7 percent year-over-year in June. Consumer prices had risen 2.9 percent in July 2018, the highest year-over-year rate since February 2012, and the current data reflect the sizable deceleration in consumer price growth over the past year.
At the same time, core inflation (which excludes food and energy) rose 2.2 percent year-over-year, up from 2.1 percent in the prior release. Other than for apparel and medical care commodities, all other major segments have seen costs rise over the past 12 months. Even with an acceleration in price growth in July, inflation appears to be stable for now, not far from the Federal Reserve’s stated goal of core price inflation around 2 percent. As such, the Federal Open Market Committee is expected to reduce short-term rates next month, building on its rate cut last month and with participants more interested in stimulating economic growth than with inflation.
- Housing Starts and Permits: The latest housing market release provided mixed news. On the downside, new residential construction declined 4.0 percent, down from an annualized 1,241,000 units in June to 1,191,000 units in July, a five-month low. The disappointing figure stemmed from weakness in the highly volatile multifamily segment, which fell from 376,000 units to 315,000 units. On a more encouraging note, single-family housing starts rose from 865,000 units to 876,000 units, the best reading since January, and it suggests that reduced mortgage rates, which are the lowest since November 2016, are starting to have an impact. Yet, overall housing starts reflect the weaknesses seen over much of the past year, up just 0.6 percent from 1,184,000 units in July 2018.
On a more promising note, housing permits—a proxy of future activity—jumped 8.4 percent in the latest report, up from 1,232,000 units at the annual rate in June to 1,336,000 units in July. That was the best reading since December, with strength in both the single-family (up from 823,000 units to 838,000 units) and multifamily (up from 409,000 units to 498,000 units) segments. Much like the starts data described above, the upward trend in single-family activity, which was the best since November, suggests that construction should accelerate in the coming months, likely boosted by mortgage rates, even as homebuilders continue to cite challenges with finding talent and with other affordability issues.
- Industrial Production: Manufacturing production declined 0.4 percent in July. It was the fifth decrease in output in the sector year to date, with gains only in May and June. Weaker global growth and lingering trade policy uncertainties continue to challenge the sector. Indeed, manufacturing production has dropped 0.5 percent over the past 12 months, the second negative year-over-year reading so far this year, with both April and July’s data being the worst datapoints on a year-over-year basis in nearly three years. Likewise, manufacturing capacity utilization dipped from 75.8 percent in June to 75.4 percent in July, with capacity in the sector lower than the 77.3 percent figure in December, which was the best since March 2008.
In July, durable and nondurable goods production decreased 0.2 percent and 0.5 percent, respectively. Twelve of the 19 major sectors had lower output in July, with two others unchanged. Sectors that experienced declines included machinery, nonmetallic mineral products, plastics and rubber products, printing and support, textile and product mills and wood products, among others. In contrast, production increased for aerospace and miscellaneous transportation equipment, furniture and related products, miscellaneous durable goods, paper and primary metals.
Meanwhile, total industrial production fell 0.2 percent in July. Declines in both manufacturing and mining (down 1.8 percent) offset improved output for utilities (up 3.1 percent). The Federal Reserve attributed the reduction in manufacturing to Hurricane Barry, which “caused a sharp but temporary decline in oil extraction in the Gulf of Mexico.” Over the past 12 months, industrial production has risen just 0.5 percent, the slowest year-over-year pace since February 2017. Total capacity utilization dropped from 77.8 percent to 77.5 percent for the month, the weakest rate since October 2017.
- NAHB Housing Market Index: The National Association of Home Builders and Wells Fargo reported that confidence edged higher in August to a three-month high. The Housing Market Index rose from 65 in July to 66 in August. Overall, builders continue to feel optimistic, especially with reduced mortgage rates, which should boost demand (even though it has not produced dramatic results yet). The index for expected single-family sales six months from now inched up from 71 to 73—a figure that suggests robust growth over the coming months. Yet, the NAHB also notes ongoing challenges, especially with the shortage of skilled labor, a “lack of buildable lots” and rising costs that hurt affordability for would-be homebuyers.
- New York Fed Manufacturing Survey: Manufacturing activity in the New York Federal Reserve Bank’s district expanded modestly for the second straight month in August after contracting in June for the first time since October 2016. The headline index inched up from 4.3 in July to 4.8 in August, with rebounds in new orders, inventories and the average employee workweek. Shipments picked up somewhat as well. Nonetheless, hiring remained in negative territory, but with the decline slowing from the prior survey.
At the same time, respondents to the Empire State Manufacturing Survey remain optimistic in their outlook for the next six months, albeit with some easing from the previous release. More than 45 percent of respondents continue to anticipate higher sales and shipments over the coming months, and 35.6 percent and 32.9 percent predict more hiring and capital expenditures, respectively. Meanwhile, expected raw material costs remained highly elevated, even as the pace of growth has decelerated from the sharp rises last year.
- NFIB Small Business Survey: The National Federation of Independent Business reported that the Small Business Optimism Index rebounded, up from 103.3 in June to 104.7 in July. Despite softening from the all-time high in August 2018 (108.8), small businesses remain upbeat overall. Twenty-six percent of respondents in July said the next three months would be a “good time to expand,” up from 24 percent in June. The rise in the headline index jumped from a net percentage of 17 percent to 22 percent, helping to buoy sentiment in the latest survey. Moreover, 28 percent of firms said they planned to make a capital expenditure in the next three to six months, up from 26 percent in the June survey.
At the same time, the labor market remained solid overall. The percentage of small business owners saying they had job openings returned to 39 percent in July, matching the all-time highs set in December and March. The net percentage planning to hire in the next three months rose from 19 percent to 21 percent, a relatively healthy figure. In addition, respondents cited the quality of labor as the top “single most important problem” for the 16th straight month.
- Philadelphia Fed Manufacturing Survey: Manufacturing activity continued to expand at a decent pace in August. The composite index of general business activity pulled back from 21.8 in July to 16.8 in August, but with notable improvements in new orders, which should bode well for future activity. At the same time, the pace of growth for shipments, employment and the average employee workweek softened, especially for the labor market variables. Indeed, hiring increased at the slowest rate since October 2016 in the latest survey.
More importantly, manufacturers in the district remain optimistic in their outlook for the next six months, albeit with some easing from the previous release. The forward-looking composite index pulled back from 38.0 in July, the strongest figure since May 2018, to 32.6 in August. Still, more than half of respondents expect new orders and shipments to rise in the coming months, with 31.3 percent and 30.2 percent anticipating increased hiring and capital spending, respectively. At the same time, anticipated pricing pressures picked up somewhat, with 46.7 percent of manufacturers seeing input costs rising over the next six months, up from 41.6 percent in the prior survey.
- Productivity and Costs: Manufacturing labor productivity fell 1.6 percent at the annual rate in the second quarter, the first decline since the first quarter of 2018. It was pulled lower by reduced output for the second straight quarter, down 2.1 percent in the second quarter. At the same time, hourly compensation costs (up 4.1 percent) helped to boost unit labor costs, which jumped 5.8 percent for the quarter. Labor productivity for durable and nondurable goods firms also declined in the second quarter, down 0.9 percent and 2.6 percent, respectively. In addition, durable and nondurable goods output fell 1.8 percent and 2.4 percent, respectively.
In contrast to manufacturing, nonfarm business labor productivity rose 2.3 percent at the annual rate in the second quarter, extending the 3.5 percent gain in the first quarter. Nonfarm output grew 1.9 percent for the quarter, slowing from 3.9 percent growth in the prior release, with unit labor costs up 2.4 percent.
- Retail Sales: Consumer spending continued to strengthen, up 0.7 percent in July and increasing for the fifth straight month. The solid gain in retail sales occurred despite weaker motor vehicles and parts sales, which fell 0.6 percent in July. At the same time, gasoline station sales jumped 1.8 percent for the month, spurred by slightly higher prices. With motor vehicles and gasoline station sales excluded, retail spending increased a healthy 0.9 percent in July.
Overall, the data suggest that Americans have accelerated their spending in recent months after being more hesitant earlier in the year. Over the past 12 months, retail sales have risen a modest 3.4 percent, or 4.2 percent year-over-year with motor vehicles and gasoline station sales excluded.
The largest increases in retail sales for the month occurred for clothing and accessories stores, electronics and appliance stores, food services and drinking places, gasoline stations, grocery stores and nonstore retailers, among others. Back-to-school shopping could be one factor contributing to the increase, but Amazon’s “Prime Day” has also been cited for the rise in nonstore retail sales. Along those lines, the structural shift toward online spending can be seen clearly, with sales for nonstore retailers jumping 16.0 percent since July 2018 to a new all-time high ($67.1 billion) but department store sales down 4.7 percent year-over-year.
- State Employment Report: Kentucky created the most net new manufacturing jobs in July, adding 3,900 workers, with Texas (up 3,500), Missouri (up 3,100), Ohio (up 3,100) and Florida (up 2,600) close behind. In addition, Texas saw the greatest job gains in the sector over the past 12 months, with manufacturing employment in the state up 25,400 since July 2018. Other states with the fastest manufacturing job growth year-over-year included California (up 14,800), Florida (up 11,800), Washington (up 11,600), Ohio (up 9,500), South Carolina (up 9,300) and Kentucky (up 9,200). Meanwhile, Vermont had the lowest unemployment rate in the nation in July, remaining at 2.1 percent.
- University of Michigan Consumer Sentiment: The Index of Consumer Sentiment fell from 98.4 in July to 92.1 in August in preliminary data, according to the University of Michigan and Thomson Reuters. This was the lowest reading since January, with Americans less upbeat about both current and future economic conditions. Consumers felt more anxious on increased trade policy uncertainty and volatility in financial markets, and the cut in interest rates heightened their concerns about the economic outlook. Still, consumer confidence remains elevated overall, even with easing this month. Final data will be released Aug. 30.
|
|
|
Thank you for subscribing to the NAM’s Monday Economic Report.
If you’re part of an NAM member company and not yet subscribed, email us. If you’re not an NAM member, become one today!
|
|
|
|
|
|
|
|
|
|
|

