 |
| If you’re having trouble reading this, click here. |
|
| MONDAY ECONOMIC REPORT |
|
|
|
|
| Essential Takes on Leading Economic Indicators |
|
| By Chad Moutray, Ph.D., CBE – November 4, 2019 – SHARE |
|
<
|
|
|
| Consumer Spending Lifted Third Quarter Growth, but Investment Lagged |
|
| The Weekly Toplines |
|
- The U.S. economy grew 1.9% at the annual rate in the third quarter. The consumer continued to help prop up economic growth, with personal consumption expenditures up a modest 2.9% at the annual rate for the quarter. Residential fixed investment rose a solid 5.1% in the third quarter, the first positive reading for the housing market since the fourth quarter of 2017.
- Business spending served as a drag on economic growth for the second consecutive quarter, with businesses pulling back on investments in equipment and structures in light of global headwinds and ongoing trade uncertainties. Nonresidential fixed investment declined 1.0% and 3.0% in each of the past two reports, respectively.
- For the year, I continue to estimate 2.3% growth for 2019, slowing to 1.8% growth in 2020. There are obviously strong cases to be made for both upside and downside risks in that outlook, at least for now.
- The Institute for Supply Management® reported that manufacturing activity contracted for the third straight month, stabilizing somewhat on slower declines in new orders and employment. Exports rebounded in October, but production declined to the worst reading since April 2009.
- In addition, manufacturing employment fell by 36,000 workers in October, extending the loss of 5,000 workers in September and the largest monthly decline in the sector in 10 years. Yet, the decrease stemmed largely from the effects of the GM strike, which has now been settled. Motor vehicles and parts employment plummeted by 41,600 in October, and a rebound in the November data would be expected.
- In the larger economy, nonfarm payrolls increased by 128,000 in October, beating the consensus expectation of around 85,000. The unemployment rate inched up from 3.5%, the lowest since December 1969, to 3.6%. Still, the labor market remains quite tight, and manufacturers and other businesses continue to cite an inability to find talent as a top concern.
- Personal income and spending rose 0.3% and 0.2% in September, respectively. Personal consumption expenditures have been one of the stronger elements in the economy (see above), rising 3.9% year-over-year. Meanwhile, manufacturing wages and salaries were $920.7 billion in September, up by a healthy 3.8% since September 2018.
- As expected, the Federal Open Market Committee voted to reduce short-term interest rates by 25 basis points after its Oct. 29–30 meeting—its third cut in rates this year. The Federal Reserve is committed to taking steps to help prolong the economic recovery. With that said, future moves are contingent on incoming data, and the expectation is that the FOMC will hit the pause button for now. Indeed, I do not anticipate another cut in the target federal funds rate in 2020 at this point, unless economic conditions weaken further.
|
 |
|
| Economic Indicators |
|
Last Week's Indicators:
(Summaries Appear Below)
Monday, October 28
Chicago Fed National Activity Index
Dallas Fed Manufacturing Survey
International Trade in Goods (Preliminary)
Tuesday, October 29
Conference Board Consumer Confidence
Gross Domestic Product by Industry (Second Quarter)
Wednesday, October 30
ADP National Employment Report
Business Employment Dynamics
FOMC Monetary Policy Statement
Gross Domestic Product (Third Quarter)
Thursday, October 31
Employment Cost Index
Personal Consumption Expenditures Deflator
Personal Income and Spending
Friday, November 1
BLS National Employment Report
Construction Spending
ISM® Manufacturing Purchasing Managers’ Index®
|
|
|
|
This Week's Indicators:
Monday, November 4
Factory Orders and Shipments
Tuesday, November 5
International Trade Report
Job Openings and Labor Turnover Survey
Wednesday, November 6
Productivity and Costs
Thursday, November 7
Consumer Credit
Friday, November 8
University of Michigan Consumer Sentiment
|
|
|
| Deeper Dive |
|
- ADP National Employment Report: Manufacturing employment declined for the second straight month, with the sector losing 4,000 workers in October, according to ADP estimates. It was the fourth decrease in net hiring for manufacturers year to date, but with employment growth in the sector averaging more than 3,300 per month over that time frame. That is a slower pace than last year, which averaged nearly 18,000 each month through the first 10 months. This shows how much hiring has eased so far in 2019 due to slowing global growth and trade uncertainties.
Meanwhile, total nonfarm private employment rose by 125,000 in October, an improvement from the gain of 93,000 in September but notably slower than earlier in the year. Using the time frames discussed above, private-sector payroll growth has averaged almost 157,000 per month year to date, slowing from nearly 224,000 per month between January and October 2018. In October, all the gains occurred in the services sector, which had 138,000 more workers, with goods-producing industries losing 13,000 employees for the month.
In addition, small and medium-sized businesses (i.e., those with fewer than 500 employees) generated 64.8% of the net job creation in October.
- BLS National Employment Report: Manufacturing employment fell by 36,000 workers in October, extending the loss of 5,000 workers in September and the largest monthly decline in the sector in 10 years. Yet, the decrease stemmed largely from the effects of the GM strike, which has now been settled. Motor vehicles and parts employment plummeted by 41,600 in October, and a rebound in the November data would be expected. The average hourly earnings for production and nonsupervisory workers was $22.28 in October, up a modest 2.7% year-over-year. However, this is down from a year-over-year growth rate of 3.4% in July.
Excluding automobiles, net hiring among manufacturers increased by 5,600 in October. The largest gains for the month occurred in fabricated metal products, food manufacturing and wood products. Beyond motor vehicles and parts, other notable declines in employment in October included apparel, furniture and related products, miscellaneous durable goods, plastics and rubber products, primary metals and printing and related support activities, among others.
Because of the large decline in the latest data, manufacturing job growth has slowed to just 2,000 additional workers year to date. That contrasts with 217,000 manufacturing employees created through the first 10 months of 2018. Overall, manufacturers continue to struggle with global headwinds and uncertainties on the trade front, and the data mirror the challenges seen in other indicators. Approving the United States–Mexico–Canada Agreement, securing a bilateral trade agreement with China and passing a long-term reauthorization of the Export-Import Bank are critical to restoring certainty for manufacturers in the United States.
In the larger economy, nonfarm payrolls increased by 128,000 in October, easing from the gain of 180,000 in September but higher than the consensus expectation of around 85,000. Much like the manufacturing data, nonfarm payrolls have slowed year to date (although not as much), down from an average of 226,000 jobs created per month through the first 10 months of 2018 to 167,000 per month through the first 10 months of 2019. Meanwhile, the unemployment rate inched up from 3.5%, the lowest since December 1969, to 3.6%, and the so-called “real unemployment” rate edged up from 6.9%, a rate not seen since December 2000, to 7.0%. Still, the labor market remains quite tight, and manufacturers and other businesses continue to cite an inability to find talent as a top concern.
- Business Employment Dynamics: Net employment growth rose by 525,000 in the first quarter of 2019, slowing from the gain of 811,000 in the fourth quarter of 2018. Manufacturers had gross job gains of 402,000 in the first quarter, with 367,000 from expanding establishments and 35,000 from new establishments. At the same time, there were gross job losses of 376,000 in the first quarter, with 336,000 from contracting establishments and 40,000 from closing establishments. Therefore, there was a net employment change of 26,000 more workers in the manufacturing sector in the first quarter, down from the net gain of 87,000 in the fourth quarter.
In addition, there were 5,000 manufacturing start-ups in the first quarter, or a rate of 1.6% of all establishments in the sector. Those new establishments (or “births”) employed 20,000 workers in the first quarter, down from 25,000 in the fourth quarter. The pace of manufacturing start-ups has been relatively flat for about a decade, and notably, entrepreneurship in the sector (as well as economy-wide) has slowed from the rates in the 1990s and early 2000s.
- Chicago Fed National Activity Index: The Chicago Federal Reserve Bank reported that the National Activity Index reflected weakness again in September, continuing to seesaw from month to month over much of this year. The headline index fell from 0.15 in August to -0.45 in September, the lowest level since April. Index readings above zero are consistent with economic growth that is above trend and vice versa. The manufacturing sector contributed to the lower figure in September, with production in the sector down 0.5% in the month after rebounding in the prior release. Overall, manufacturing production was negative year-over-year for the third straight month, and employment was also softer than desired.
- Conference Board Consumer Confidence: Consumer sentiment fell to a four-month low, with the headline index down from 126.3 in September to 125.9 in October. Americans felt somewhat more positive in their views of current economic conditions, but their perceptions of the short-term outlook for the coming months declined. Despite the diminished assessments in October, consumers remained more positive than not. In fact, Lynn Franco, the Conference Board’s senior director of economic indicators, noted that “confidence levels remain high, and there are no indications that consumers will curtail their holiday spending.”
Indeed, the percentage of respondents suggesting that business conditions were “good” rose from 37.4% to 39.2%, while those noting conditions were “bad” ticked down from 12.2% to 11.2%. Moreover, the percentage of Americans feeling that jobs were “plentiful” increased from 44.5% to 46.9%, which remained significantly higher than those responding that jobs were “hard to get,” which inched up from 11.0% to 11.8%.
- Construction Spending: Private manufacturing construction spending rose 1.2% in the latest data, up from $71.42 billion at the annual rate in August to $72.29 billion in September. Despite the monthly improvement, construction activity has declined modestly over the past 12 months, down from 3.7% from $75.10 billion in September 2018. In addition, private manufacturing construction activity remains well below the all-time high of $87.48 billion in June 2015, even as there has been progress from the recent trough of $68.82 billion in August 2017.
Meanwhile, total private construction spending edged up 0.2% in September. Private residential construction spending increased 0.6% in September, with better single-family activity (up 1.3%) being partially offset by a decline in multifamily housing construction (down 0.7%). On a year-over-year basis, private residential and nonresidential construction activity has fallen 3.6% and 5.7% since September 2018, respectively. At the same time, public-sector construction increased 1.5%, with 6.6% growth over the past 12 months.
- Dallas Fed Manufacturing Survey: Manufacturers reported contracting activity in October following two months of slight expansions. The composite index declined from 1.5 in September to -5.1 in October, with this indicator down in six of the past 11 months. Declining new orders were largely responsible for this latest weakness, with slowing growth for production, shipments, capacity utilization and employment. At the same time, the pace of growth for capital expenditures and wages and benefits both improved, and the costs for raw materials also picked up a bit. The sample comments continued to note worries about slower global growth, political and trade policy uncertainties and difficulties in finding sufficient talent.
Moving forward, manufacturers in the Texas district felt cautiously positive in their outlook. The index for general business activity six months from now rebounded from -6.8 in September to 2.4 in October. Most of the key measures improved in the latest survey, with 44.1% of respondents predicting increased new orders and roughly one-third anticipating more hiring and capital spending.
- Employment Cost Index: Private manufacturing wages and salaries rose 0.7% in the third quarter, the same pace as in the second quarter. That translated into 3.1% growth over the past 12 months, the fastest year-over-year pace of growth since the first quarter of 2002, or in more than 17 years. For all private-sector employees, wages and salaries jumped 0.9% in the third quarter, the strongest gain in six quarters, with 3.0% growth year-over-year.
Benefits costs for manufacturing employees increased 0.4% in the third quarter, the slowest gain year to date. On a year-over-year basis, benefits have risen a modest 2.2%. As a result, total manufacturing compensation increased 0.6% for the quarter, or 2.8% year-over-year.
- FOMC Monetary Policy Statement: As expected, the Federal Open Market Committee voted to reduce short-term interest rates by 25 basis points after its Oct. 29–30 meeting—its third cut in rates this year. The federal funds target range will now be 1.50 to 1.75%. While the economy continues to expand modestly with solid job growth and consumer spending, the Federal Reserve cited weaker business investment and exports as concerns. Participants also noted that core inflation continues to run below the committee’s target of 2%, which would indicate some softness in the marketplace. As a result, the FOMC is taking steps to help prolong the economic recovery, continuing a push away from normalization seen since the first rate cut at its July 30–31 meeting.
Kansas City Federal Reserve Bank President Esther George and Boston Federal Reserve Bank President Eric Rosengren voted against the FOMC cutting rates at this meeting, with both preferring to keep the federal funds target rate unchanged at 1.75 to 2.00%. They viewed that strength in the U.S. economy did not necessitate further easing in interest rates. Moving forward, the FOMC will “continue to monitor the implications of incoming information for the economic outlook” in determining future changes in monetary policy. I do not anticipate another cut in the target federal funds rate in 2020 at this point, unless economic conditions weaken further.
- Gross Domestic Product (Third Quarter): The U.S. economy grew 1.9% at the annual rate in the third quarter, easing just a bit from the 2.0% growth rate in the second quarter. Consumer spending, government expenditures and the housing market were bright spots, contributing 2.46 percentage points to top-line growth for the quarter, but that was weighed down by inventory spending, net exports and nonresidential fixed investment.
Notably, business spending served as a drag on economic growth for the second consecutive quarter, with businesses pulling back on investments in equipment and structures in light of global headwinds and ongoing trade uncertainties. Nonresidential fixed investment declined 1.0% and 3.0% in each of the past two reports, respectively.
For the year, I continue to estimate 2.3% growth for 2019, slowing to 1.8% growth in 2020. There are obviously strong cases to be made for both upside and downside risks in that outlook, at least for now.
Digging deeper into the third quarter release, the consumer continued to help prop up economic growth, with personal consumption expenditures up a modest 2.9% at the annual rate for the quarter. This was slower than the 4.6% growth rate in the second quarter, but was still a decent pace. Meanwhile, goods exports rose 1.6% in the third quarter, bouncing back from a decline of 5.9% in the second quarter. Goods imports edged up 0.1% and 0.4% in the past two quarters, respectively. The drag from net exports in this report came from trade in services, with services imports up 4.4% but exports off 0.8%.
It was also notable that residential fixed investment rose a solid 5.1% in the third quarter. It was the first positive reading for the housing market since the fourth quarter of 2017, and this suggests that Americans have reacted favorably to recent cuts in mortgage rates. It also coincides with other data showing improvements in housing sales and construction.
- Gross Domestic Product by Industry (Second Quarter): Real GDP grew 2.0% at the annual rate in the second quarter, as previously reported, down from 3.1% in the first quarter. According to new data from the Bureau of Economic Analysis, manufacturing added 0.05 percentage points to top-line growth in the second quarter, which was an improvement from the 0.40 percentage points that it subtracted from GDP growth in the first quarter. Nonetheless, manufacturing accounted for 11.0% of real GDP in the second quarter, down from 11.1% in the prior quarter.
Overall, manufacturing value-added output rose 1.7%, up from $2.338 trillion in the first quarter to $2.355 trillion in the second quarter. This was not far from the all-time high recorded in the fourth quarter of 2018, which was $2.365 trillion. In the second quarter, value-added output for durable goods increased from $1.336 trillion to $1.342 trillion, a new record, with nondurable goods activity also higher, up from $1.002 trillion to $1.013 trillion. Bright spots were seen in the chemicals, computer and electronic products, fabricated metal products and machinery sectors, but with notable drags from the aerospace and other transportation equipment, motor vehicles and parts, primary metals and textile segments.
The data were similar when adjusting for inflation. Real value-added output in manufacturing inched up from $2.165 trillion in the first quarter to $2.167 trillion in the second quarter, with a slight increase for durable goods but a small decline for nondurable goods. Those figures are in chained 2012 dollars. The data suggest slower growth for manufacturers so far in 2019, mirroring other indicators, as real value-added output has pulled back in the sector from the all-time high in the fourth quarter of 2018 ($2.185 trillion).
Similarly, manufacturing gross output has slowed since reaching the record high at the end of last year ($6.304 trillion), even as activity increased for the quarter from $6.276 trillion to $6.285 trillion. Gross output for durable goods pulled back from its all-time high of $3.279 trillion in the first quarter to $3.245 trillion in the second quarter, whereas gross output for nondurable goods firms improved somewhat from $2.997 trillion to $3.040 trillion in this report.
- ISM® Manufacturing Purchasing Managers’ Index®: The Institute for Supply Management® reported that manufacturing activity contracted for the third straight month, even as it improved slightly from the weakest reading in 10 years. The composite index ticked up from 47.8 in September to 48.3 in October, stabilizing somewhat on slower declines in new orders and employment. In addition, exports, which had contracted at the fastest rate since March 2009 in the prior survey, rebounded in October, up from 41.0 to 50.4. At the same time, production declined further, down from 47.3 to 46.2, the worst reading since April 2009. The GM strike might have impacted that figure in October negatively, but in general, activity has softened due to slower global growth and trade uncertainties.
Meanwhile, pricing pressures—a major concern among manufacturers at this time last year—fell for the fifth consecutive month. In October, the index for prices dropped from 49.7 to 45.5, the lowest level since February 2016. One year ago, that figure was 71.6, illustrating the deceleration in raw material costs since then.
- International Trade in Goods (Preliminary): In advance statistics, the goods trade deficit narrowed to the lowest level since June 2018, down from $73.06 billion in August to $70.39 billion in September. Overall trade volumes were lower for the month, with the decline in goods imports (down $4.59 billion) outpacing the decrease in goods exports (down $2.20 billion). For goods exports, the largest declines occurred in automotive vehicles, foods, feeds and beverages and industrial supplies. Final data will be released Nov. 5, which will also include the service-sector trade surplus.
- Personal Consumption Expenditures Deflator: The PCE deflator was flat for the second straight month in September. Reduced energy prices helped keep a lid on costs, down 2.0% and 1.3% in August and September, respectively. The core PCE deflator, which excludes food and energy prices, was also flat in September, the slowest pace since February. Over the past 12 months, the PCE deflator has risen 1.3%, down from 1.4% in August. At the same time, core inflation was 1.7% in September, off slightly from 1.8% year-over-year in August. For nine consecutive months, or in every month so far in 2019, the core PCE deflator has remained below the Federal Reserve’s stated goal of 2.0% core inflation.
As such, the pricing data have provided some comfort to the Federal Open Market Committee, allowing participants the luxury of being more “dovish” in setting monetary policy. The Federal Reserve has reduced short-term rates three times in 2019, with the most recent move coming at the meeting last week (see above). Policymakers are more concerned with keeping the economic recovery moving at this point than with inflationary pressures. With that said, the FOMC is likely to wait for incoming data on economic growth before changing policy again.
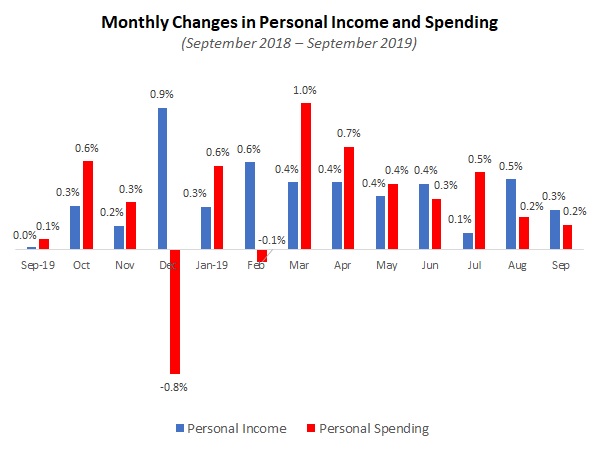
- Personal Income and Spending: Personal income rose 0.3% in September, slowing somewhat from the 0.5% gain in August but still a solid figure. Over the past 12 months, personal income has risen a robust 4.9%, up from 4.6% year-over-year in the previous release. In addition, manufacturing wages and salaries were $920.7 billion in September, off slightly from $922.2 billion in August but up by a healthy 3.8% since September 2018.
Meanwhile, personal consumption expenditures increased 0.2% for the second straight month. Goods spending was flat for the month, however, with durable goods spending up by 0.4% but purchases of nondurable goods off 0.1%. On a year-over-year basis, personal spending has risen 3.9%, with durable and nondurable goods sales up 4.6% and 3.4% since September 2018, respectively.
The saving rate rose from 8.1% in August to 8.3% in September. In general, Americans have saved more this year than last, with the saving rate averaging 8.2% year to date in 2019, up from 7.7% through the first nine months of 2018.
|
|
Thank you for subscribing to the NAM’s Monday Economic Report.
If you’re part of an NAM member company and not yet subscribed, email us. If you’re not an NAM member, become one today!
|
|
|
|
|
|
|
|
|
|
|

