 |
| If you’re having trouble reading this, click here. |
|
| MONDAY ECONOMIC REPORT |
|
|
|
|
| Essential Takes on Leading Economic Indicators |
|
| By Chad Moutray, Ph.D., CBE – February 24, 2020 – SHARE |
|
|
| |
|
| Eurozone Manufacturing Activity Continues to Stabilize |
|
| The Weekly Toplines |
|
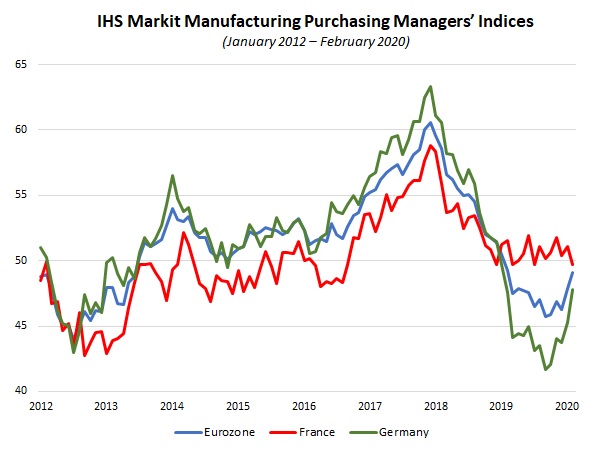
- The IHS Markit Flash Eurozone Manufacturing PMI remained challenged in February but continued to stabilize, rising to the best reading in 12 months. It was led by improvements in Germany, which has contracted in every month since December 2018, but improved to the weakest rate of decline in 13 months.
- Manufacturing activity in the United Kingdom expanded at the best rate in 10 months in February in the aftermath of Brexit, improving from neutral in January. In contrast, French manufacturers reported the first decline in activity since August, even as overall economic conditions strengthened somewhat to modest growth in February.
- In the United States, the manufacturing data provided mixed results. The IHS Markit Flash U.S. Manufacturing PMI slowed in February to the weakest rate of expansion in six months. Respondents cited “delays in deliveries following the outbreak of the coronavirus in China,” which dampened sentiment and production. Yet, manufacturers felt more upbeat in their assessments of the next six months, with the index for future output rising to a 10-month high.
- On a regional level, manufacturers in the New York and Philadelphia Federal Reserve Bank districts both reported accelerating activity in February on stronger demand and shipments data, with a positive outlook for growth over the next six months.
- New residential construction pulled back 3.6% to 1,567,000 units at the annual rate in January, but the housing market figures remained solid overall, boosted by warmer-than-normal temperatures. Multifamily activity jumped to the fastest pace since December 1986, with single-family activity easing from the best reading since June 2007 but still with more than 1 million units. Over the past 12 months, new residential construction has soared 21.4%.
- This suggests that homebuyers continue to respond positively to lower mortgage rates, with the overall housing market bouncing back after being in the doldrums over much of the past few years. Homebuilder optimism also reflects that positivity, and housing permits rose to an annualized 1,551,000 units in January, a pace not seen since March 2007.
- Producer prices for final demand goods and services jumped 0.5% in January, the fastest monthly gain since October 2018 and boosted by higher costs for trade services. At the same time, producer prices for final demand goods edged up 0.1% in January, pulled lower by a 0.7% drop in energy costs for the month.
- Core inflation for goods, which excludes food and energy, increased 0.3% in January, the strongest reading in one year. However, core producer prices remain low, with 1.5% growth year-over-year, below the Federal Reserve’s stated goal of 2%.
- The U.S. dollar has risen, and yields have fallen on continued coronavirus outbreak concerns. For instance, yields on 10-year Treasury bonds fell to 1.47% on Friday, down from 1.91% at the end of 2019 and the lowest since Sept. 4.
|
 |
|
| Economic Indicators |
|
Last Week’s Indicators:
(Summaries Appear Below)
Monday, February 17
PRESIDENTS DAY HOLIDAY
Tuesday, February 18
NAHB Housing Market Index
New York Fed Manufacturing Survey
Wednesday, February 19
Housing Starts and Permits
Producer Price Index
Thursday, February 20
Conference Board Leading Indicators
Philadelphia Fed Manufacturing Survey
Friday, February 21
Existing Home Sales
IHS Markit Flash U.S. Manufacturing PMI |
|
|
|
This Week's Indicators:
Monday, February 24
Chicago Fed National Activity Index
Dallas Fed Manufacturing Survey
Tuesday, February 25
Conference Board Consumer Confidence
Richmond Fed Manufacturing Survey
Wednesday, February 26
New Home Sales
Thursday, February 27
Durable Goods Orders and Shipments
Gross Domestic Product (Revision)
Kansas City Fed Manufacturing Survey
Friday, February 28
International Trade in Goods (Preliminary)
Personal Consumption Expenditures Deflator
Personal Income and Spending
University of Michigan Consumer Sentiment (Revision) |
|
|
| Deeper Dive |
|
- Conference Board Leading Indicators: The Leading Economic Index jumped 0.8% in January, a robust growth rate that was buoyed by strength in housing permits and weekly unemployment claims. Even with the increase in the LEI in January, however, the headline measure was essentially unchanged from its level six months ago. Manufacturing new orders continued to be a drag on the LEI, albeit less so than in previous months. On the other hand, consumer confidence, the interest rate spread, lending conditions and stock prices were other bright spots.
Meanwhile, the Coincident Economic Index inched up 0.1% in January after being flat in December. Industrial production fell 0.3% in January on reduced manufacturing and utilities output. Manufacturing production decreased 0.1%. As a result, industrial production subtracted 0.04% from the CEI for the month. The other components (manufacturing and trade sales, nonfarm payrolls and personal income) were positive contributors to economic growth conditions in January.
- Existing Home Sales: The National Association of Realtors reported that existing home sales pulled back from the fastest rate since February 2018, down 1.3% from an annualized 5.53 million units in December to 5.46 million units in January. Sales strengthened in the Midwest but weakened in the West. In January, single-family and condominium and co-op activity declined 1.2% and 1.6%, respectively. Overall, existing home sales have risen a solid 9.6% over the past 12 months, up from 4.98 million units in January 2019, with single-family and condo/co-op activity up 9.7% and 8.9% year-over-year.
There were 3.1 months of supply on the market in January, up from 3.0 months in December but well below the 3.8 months recorded one year ago. As a result, inventories of existing homes for sale remain low. The median sales price for existing homes has increased 6.8% year-over-year, up to $266,300 in January.
- Housing Starts and Permits: New residential construction pulled back 3.6% in January, but the housing market figures remained solid overall, boosted by warmer-than-normal temperatures. Housing starts declined from an annualized 1,626,000 units in December, the strongest reading in 13 years, to 1,567,000 units in January. The data suggest that multifamily activity jumped to the fastest pace since December 1986, up from 553,000 to 557,000 units, with single-family activity easing from the best reading since June 2007, down from 1,073,000 to 1,010,000 units. Over the past 12 months, new residential construction has soared 21.4%, with single-family and multifamily housing starts rising 4.6% and 71.4%, respectively, since January 2019.
This suggests that homebuyers continue to respond positively to lower mortgage rates, with the overall housing market bouncing back after being in the doldrums over much of the past few years. Homebuilder optimism also reflects that positivity (see below).
The housing permits data remained very encouraging, jumping from 1,420,000 units at the annual rate in December to 1,551,000 units in January, a pace not seen since March 2007. Single-family (up from 928,000 to 987,000 units) and multifamily (up from 492,000 to 564,000 units) construction permitting both increased in January, rising to the strongest annual rates since June 2007 and May 2015, respectively. Overall, new housing permits have risen 17.9% year-over-year, with single-family and multifamily permitting up 20.2% and 13.9%, respectively, over the past 12 months. As permits are a proxy for future activity, this suggests strong growth in residential construction in the coming months.
- IHS Markit Flash U.S. Manufacturing PMI: Manufacturing activity in the United States slowed in February to the weakest rate of expansion in six months. The headline index dropped from 51.9 in January to 50.8 in February on eased new orders, output and employment. Exports fell at a faster pace, contracting for the second straight month. Respondents cited “delays in deliveries following the outbreak of the coronavirus in China,” which dampened sentiment and production. Along those lines, the service-sector index reported contracting activity for the first time since February 2016. With that said, manufacturers felt more upbeat in their assessments of the next six months, with the index for future output rising to a 10-month high.
Meanwhile, the IHS Markit Flash Eurozone Manufacturing PMI remained challenged in February but continued to stabilize. The headline index rose from 47.9 in January to 49.1 in February, the best reading in 12 months, led by improvements in demand, production and hiring, even as exports deteriorated somewhat. Yet, the index contracted for the 13th consecutive month, highlighting the ongoing struggles in Europe. Similarly, manufacturing activity in Germany, which has contracted in every month since December 2018, improved to the weakest rate of decline in 13 months. French manufacturers reported the first decline in activity since August, even as overall economic conditions strengthened somewhat to modest growth in February.
Manufacturing activity in the United Kingdom expanded at the best rate in 10 months in February in the aftermath of Brexit, improving from neutral in January. New orders, output and exports advanced in February, but employment declined marginally. Survey respondents remained upbeat about output over the coming months.
- NAHB Housing Market Index: The National Association of Home Builders and Wells Fargo reported that confidence pulled back slightly for the second straight month, with the Housing Market Index down from 75 in January to 74 in February. Despite some slippage, confidence remains not far from December’s reading (76), which was the best since June 1999. The HMI was just 62 in February 2019, for instance, and the strong builder sentiment has been boosted in recent months by lower mortgage rates and the strong labor market. The index for expected single-family sales over the next six months eased from 80 in January, a 23-month high, to 79 in February.
With that said, the NAHB cites several challenges hitting buildings, including increased regulatory constraints, a shortage of skilled labor, a lack of buildable lots and rising home prices.
- New York Fed Manufacturing Survey: Manufacturing activity in the New York Federal Reserve Bank’s district accelerated in February to the best pace in nine months, buoyed by stronger growth in new orders and shipments. The headline index rose from 4.8 in January to 12.9 in February. With that said, employment growth and input costs both slowed, and the average employee workweek edged lower for the month.
Meanwhile, respondents to the Empire State Manufacturing Survey remain positive in their outlook for the next six months, albeit with some easing in a few key measures. The forward-looking index for business conditions inched down from 23.6 in January to 22.9 in February but remained strong overall. Nearly 45% of respondents expect sales to rise over the coming six months, with 29.0% and 32.6% anticipating increased hiring and capital spending, respectively. The forward-looking prices paid index pulled back in February but continued to be somewhat elevated.
- Philadelphia Fed Manufacturing Survey: Manufacturing activity accelerated sharply in February, soaring to the best reading in two years. The composite index of general business activity jumped from 17.0 in January to 36.7 in February on stronger demand, shipments and the average employee workweek. Indeed, more than half of respondents said that new orders had increased in February relative to January, up from 45.7% who said the same thing in the previous survey, and more notably, the percentage suggesting that sales had declined dropped from 27.5% to 16.7%. At the same time, hiring softened to a six-month low.
Meanwhile, manufacturers in the district remain very positive in their outlook for the next six months. The forward-looking composite index rose from 38.4 to 45.4, the strongest reading since March 2018. Nearly 63% of respondents expect new orders to rise in the coming months, with 31.3% and 33.9% predicting increases in employment and capital expenditures, respectively. In special questions, firms anticipate 3.0% growth over the next year for wages and salaries, with price growth for their goods and services rising 2.5%. (Interestingly, they see overall consumer prices increasing 2.0% over the next year.)
- Producer Price Index: Producer prices for final demand goods and services jumped 0.5% in January, the fastest monthly gain since October 2018. At the same time, producer prices for final demand goods edged up 0.1% in January, pulled lower by a 0.7% drop in energy costs for the month. Food prices rose 0.2%. Core inflation for goods, which excludes food and energy, increased 0.3% in January, the strongest reading in one year. Meanwhile, producer prices for final demand services soared 0.7% in January, which was also the best monthly increase since October 2018, buoyed by higher costs for trade services.
Over the past 12 months, producer prices for final demand goods and services have risen 2.1%, up sharply from 1.3% in the previous release. In addition, core producer prices have grown 1.5% year-over-year (seasonally adjusted), up from 1.4% year-over-year in December. To illustrate just how much core PPI growth has eased over the past 12 months, the seasonally adjusted year-over-year rate registered 2.5% in January 2019.
Overall, the data in January reflected the higher costs of services for producers, but core prices continue to suggest that inflationary pressures remain low, at least for now. Core prices have remained below the Federal Reserve’s stated goal of 2% for seven straight months. As a result, the Federal Open Market Committee is unlikely to shift its monetary policy stance based on these figures.
|
|
| Take Action |
|
- If you have not already done so, please take a moment to complete the latest NAM Manufacturers’ Outlook Survey. This 25-question survey will help us gauge how manufacturing sentiment has changed since the fourth quarter survey. The current survey includes special questions on trade deals, the coronavirus outbreak, the challenge of counterfeit goods, tax and regulatory impacts and workforce challenges. To complete the survey, click here. Responses are due by Friday, Feb. 28, at 5:00 p.m. EST. As always, all responses are anonymous.
|
|
|
Thank you for subscribing to the NAM's Monday Economic Report.
If you're part of an NAM member company and not yet subscribed, email us. If you're not an NAM member, become one today!
|
|
|
|
|
|
|
|
|
| Interested in becoming a presenter of the Monday Economic Report? Email us. |
|
| Questions or comments? Email NAM Chief Economist Chad Moutray at [email protected]. |
|
| You received this email because you signed up for the NAM's Monday Economic Report as a part of your NAM membership. |
|
| Unsubscribe |
|
| © 2020 National Association of Manufacturers |
|
 |
|
|
|
|
|
|
|
|
