 |
| If you’re having trouble reading this, click here. |
|
| MONDAY ECONOMIC REPORT |
|
|
|
|
| Essential Takes on Leading Economic Indicators |
|
| By Chad Moutray, Ph.D., CBE – March 2, 2020 – SHARE |
|
|
| |
|
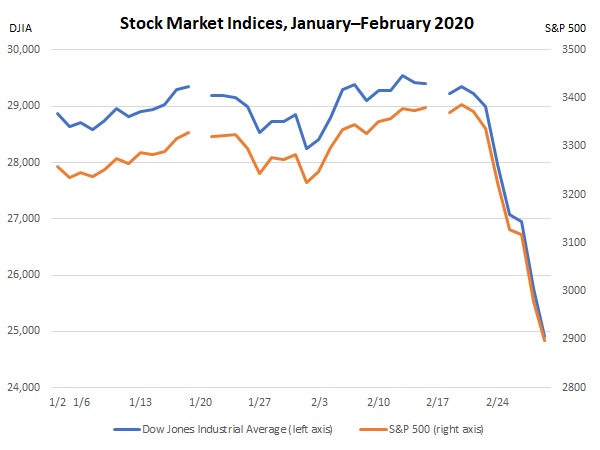
| Financial Markets Rocked by Coronavirus and Global Outlook Worries |
|
| The Weekly Toplines |
|
- Financial markets were rocked last week by worries about the spread of the coronavirus and the possible negative impacts of the outbreak on global growth. The Dow Jones Industrial Average and the Standard & Poor’s 500 indices have fallen at least 13% since all-time highs recorded in recent weeks, and equities are now in correction territory.
- At the same time, uncertainty in the outlook has also created a rush to safety in the markets, with markets pushing bond prices higher and yields to record lows. The Federal Open Market Committee will be under increased pressure to lower interest rates further, and the probability of such as action at the March 19–20 meeting (or sooner) have risen substantially. In a statement issued on Friday afternoon, Chair Jerome Powell said that the Federal Reserve will “use our tools and act as appropriate to support the economy.” This suggests action sooner than later on rates.
- Interestingly, much of the recent economic data support the view that manufacturing was stabilizing in January before the worries about the coronavirus outbreak.
- For instance, new orders for core capital goods—a proxy of capital spending in the U.S. economy—increased 1.1% in January, with 0.9% growth seen over the past 12 months. Still, the data largely reflect the challenges seen over the past year, with new orders durable goods orders excluding transportation equipment essentially flat since January 2019.
- The regional Federal Reserve Bank surveys were mostly higher in their February surveys, including the Dallas Fed’s release last week. Manufacturing activity in Texas eked out its first positive reading since September, and the Kansas City Fed reported rebounding new orders production and shipments, even as hiring remained weaker than desired.
- Similarly, the Index of Consumer Sentiment from the University of Michigan and Thomson Reuters jumped to the highest point since March 2018, or nearly two years. While the coronavirus outbreak was mentioned by some of the respondents, the survey mostly took place before last week’s steep decline in financial markets. The Conference Board’s report also noted stronger consumer confidence, albeit with some lessened assessments of the job market.
- Personal income jumped 0.6% in January, picking up strongly following the 0.1% gain seen in December. Over the past 12 months, personal income rose by a solid 4.0%. The savings rate rose to 7.9%, a nine-month high, but has trended lower over the past year. Nonetheless, personal spending slowed to 0.1% growth in January.
- The housing market continues to be robust. New single-family home sales jumped 7.9% to 764,000 units in January, starting the new year off on a strong note at a pace not seen since July 2007. Overall, new home sales have soared by a very robust 18.6% year-over-year. Homebuyers reacted favorably to reduced mortgage rates and a better outlook, and the housing market has also benefited from warmer-than-normal temperatures in both December and January.
|
 |
|
| Economic Indicators |
|
Last Week’s Indicators:
(Summaries Appear Below)
Monday, February 24
Chicago Fed National Activity Index
Dallas Fed Manufacturing Survey
Tuesday, February 25
Conference Board Consumer Confidence
Richmond Fed Manufacturing Survey
Wednesday, February 26
New Home Sales
Thursday, February 27
Durable Goods Orders and Shipments
Gross Domestic Product (Revision)
Kansas City Fed Manufacturing Survey
Friday, February 28
International Trade in Goods (Preliminary)
Personal Consumption Expenditures Deflator
Personal Income and Spending
University of Michigan Consumer Sentiment (Revision) |
|
|
|
This Week's Indicators:
Monday, March 2
Construction Spending
ISM® Manufacturing Purchasing Managers’ Index®
Tuesday, March 3
None
Wednesday, March 4
ADP National Employment Report
Thursday, March 5
Factory Orders and Shipments
Productivity and Costs (Revision)
Friday, March 6
BLS National Employment Report
International Trade Report |
|
|
| Deeper Dive |
|
- Chicago Fed National Activity Index: The Chicago Federal Reserve Bank’s National Activity Index remained negative for the fourth time in the past five months despite rising from -0.51 in December to -0.25 in January. Negative readings suggest that the U.S. economy is growing below its historical average. Reduced industrial production once again helped pull the NAI lower, with manufacturing output down 0.1% in January and off 1.3% year-over-year. Hiring was a slight drag on the NAI in the latest data, but the rebounding housing market was one of the bright spots.
Overall, the three-month moving average for the NAI registered -0.09 in January, and it has been less than zero for 12 straight months, illustrating the challenging economic environment over the past year. Nonetheless, the index is not currently consistent with an economic downturn, which would be associated with a three-month moving average of -0.70 or lower.
- Conference Board Consumer Confidence: Consumer sentiment inched higher, with the headline index up from 130.4 in January to 130.7 in February. The underlying data were mixed, however, with Americans more upbeat in their outlook for the next six months but less confident about current economic conditions. Overall, consumers continue to be mostly upbeat, with elevated confidence levels, buoyed by favorable assessments of income growth. Along those lines, the percentage of respondents expecting higher incomes moving forward edged up from 21.6% to 22.0%, with those predicting reduced income growth falling from 8.0% to 6.7%.
The labor market data were slightly weaker in February, but still solid. The percentage of Americans feeling that jobs were “plentiful” decreased from 47.2% to 44.6%, which remained significantly higher than those responding that jobs were “hard to get,” which rose from 11.9% to 14.8%. Meanwhile, the percentage of respondents suggesting that business conditions were “good” dropped from 40.0% to 38.6%, while those noting conditions were “bad” increased from 10.4% to 11.9%.
- Dallas Fed Manufacturing Survey: The composite index of general business activity in the Dallas Federal Reserve Bank’s district in February eked out its first positive reading since September, a sign of stabilization in the region. The underlying data were mixed, with faster growth for production and wages and salaries but slower expansions for new orders, capacity utilization, shipments and capital expenditures. Despite wages accelerating, hiring turned negative for the first time since December 2016 in this survey. The sample comments noted worries about the coronavirus outbreak on sales and the supply chain.
Nonetheless, manufacturers in the Texas district continued to feel positive in their assessments for the next six months, with the forward-looking index for general business activity increasing from 7.6 in January to 18.0 in February, a 10-month high. At least 43% of respondents predicted increased orders and production over the coming months, with 33.1% and 30.2% of those completing the survey anticipate stronger hiring and capital spending over the coming months, respectively.
- Durable Goods Orders and Shipments: New durable goods orders edged down 0.2% in January after jumping by 2.9% in December. The decline was led by a significant drop in sales for defense aircraft and parts, which can be highly volatile from month to month, with motor vehicles and parts orders also lower, down 0.8% in January. Excluding transportation equipment, new orders for durable goods rose 0.9% in January, accelerating from the 0.1% gain seen in December. Looking specifically at the latest data, new orders were higher for computers and electronic products, fabricated metal products, machinery and primary metals in January, but weaker for electrical equipment and appliances.
More importantly, new orders for core capital goods (or nondefense capital goods excluding aircraft)—a proxy for capital spending in the U.S. economy—increased 1.1% in January, with 0.9% growth seen over the past 12 months.
Despite some progress at the core level in January, the data continue to reflect the challenges in the manufacturing sector experienced over the past year. New durable goods orders were off 3.9% year-over-year, but with transportation equipment excluded, demand has been essentially flat since January 2019, down 0.1% year-over-year.
Meanwhile, durable goods shipments were also off by 0.2% in January, declining for the seventh consecutive month. With transportation equipment excluded, shipments rose by 0.5% after being unchanged in the prior month. Core capital goods shipments rose 1.1% for the month. On a year-over-year basis, durable goods shipments were down 3.2%, but with an increase of 0.1% with transportation equipment excluded. Core capital goods shipments have also been essentially flat (up 0.1%) since January 2019.
- Gross Domestic Product (Revision): The U.S. economy grew 2.1% at the annual rate in the fourth quarter, unrevised from the previous estimate and matching the growth rate seen in the third quarter. Durable goods consumption, exports, federal government spending, private inventories, residential investment and service-sector spending were revised higher in the latest figures, but nondurable goods consumption, nonresidential fixed investment, state and local government spending were somewhat lower than previously estimated.
Overall, the data continue to reflect the economic impacts of global headwinds and trade uncertainties in the fourth quarter, with businesses hesitant to invest in their firms and sizable declines in exports and imports, especially the latter. As a result, durable goods and service-sector consumer spending, government expenditures, the housing market and net exports were positive contributors to real GDP growth in the fourth quarter, even as consumer purchasing slowed. Nondurable goods spending, nonresidential fixed investment and business inventory spending were the notable drags.
In 2019, real GDP rose by 2.3%, easing from 2.9% growth in 2018. The forecast is for 1.2% growth in the first quarter of 2020, with the U.S. economy expanding by 1.8% for the year. There remain notable uncertainties in the outlook, however, with the coronavirus outbreak negatively altering perceptions about global growth in 2020.
- International Trade in Goods (Preliminary): In advance statistics, the goods trade deficit narrowed from $68.67 billion in December to $65.50 billion in January. Trade volumes were lower overall, with the decline in goods imports (down $4.57 billion) outpacing the fall in goods exports (down $1.40 billion). Goods exports and imports were at the lowest levels since February 2018 and November 2017, respectively. Capital goods and industrial supplies led the reductions for each figure. Final data will be released Mar. 6, which will also include the service-sector trade surplus.
- Kansas City Fed Manufacturing Survey: Manufacturing activity in the district rebounded in February, expanding very modestly for the first time since May. The composite index increased from -1 in January to 5 in February, boosted by recoveries in new orders, exports, production and shipments. Yet, employment declined for the seventh time in the past eight months, with the average workweek narrowing once again. The sample comments were dominated by worries surrounding the coronavirus and its impacts on sales and the supply chain. In special questions, roughly half of respondents cited negative effects to their business from coronavirus in 2020, but at the same time, at least 40% noted positives to activity from the U.S.–Mexico–Canada Agreement signing and the Phase 1 China trade deal this year.
In the outlook, manufacturers remained cautiously positive about activity over the next six months, with the forward-looking composite index up from 14 to 16, largely on improved perceptions about future sales. Shipments, production and employment were also expected to increase strongly over the coming months, with exports and input costs rising very modestly.
- New Home Sales: New single-family home sales jumped 7.9% from 708,000 units in December to 764,000 units in January, starting the new year off on a strong note at a pace not seen since July 2007. Data were higher in every region of the country except for the South in January. Overall, new home sales have soared by a very robust 18.6% year-over-year, up from 644,000 units in January 2019. Homebuyers reacted favorably to reduced mortgage rates and a better outlook, and the housing market has also benefited from warmer-than-normal temperatures in both December and January.
There were 5.1 months of supply on the market in January, down from 5.5 months in December and the lowest inventory level of new homes for sales since March 2017. The median sales price was $348,200 in the latest data, up 14.0% from the $305,400 median in January 2019.
- Personal Consumption Expenditures Deflator: The PCE deflator inched up 0.1% in January, easing from the 0.3% growth rate seen in December. Reduced energy costs, which were down 0.7% in January, helped to keep a lid on price growth for the month despite food costs rising by 0.3%. The core PCE deflator, which excludes food and energy prices, also increased by 0.1% in January, down from 0.2% in December. Over the past 12 months, the PCE deflator rose 1.7%, up from 1.5% growth in the previous release and the fastest pace since December 2018. At the same time, core inflation registered 1.6% in January, edging up from 1.5% year-over-year in December.
Overall, the core PCE deflator remained below the Federal Reserve’s stated goal of 2.0% core inflation for 13 straight months. As such, inflationary pressures are not a concern for the Federal Open Market Committee currently. Instead, the Federal Reserve will continue to focus on extending the economic recovery, especially considering concerns about the global economic outlook. The prospects for further interest rate cuts have risen substantially over the course of the past week.
- Personal Income and Spending: Personal income jumped 0.6% in January, picking up strongly following the 0.1% gain seen in December. Over the past 12 months, personal income rose 4.0%, a solid figure and up from 3.6% year-over-year in the previous release.
Personal consumption expenditures edged up 0.1% in January for the second straight month. Goods spending also grew by 0.1% for the month, led by strength in durable goods (up 0.5%) but pulled lower by reduced purchasing for nondurable goods (down 0.2%). On a year-over-year basis, personal spending increased 4.5%, with durable and nondurable goods sales up 4.8% and 3.8% since January 2019, respectively.
With income growth outpacing spending, the savings rate rose from 7.5% in December to 7.9% to January, a nine-month high. With that said, Americans have largely reduced their savings (and conversely, increased their spending) over the past year, with the savings rate peaking at 8.8% in February 2019.
- Richmond Fed Manufacturing Survey: Manufacturing activity fell somewhat in February after rebounding sharply in January, with the composite index of general business activity declining from 20 to -2. The weaker data were led by falling new orders, with shipments, capacity utilization, employment and capital expenditures softening. Despite the disappointing readings, wage growth remained solid, and manufacturers in the district continued to be optimistic about the next six months. Indeed, the outlook for new orders rose to its best reading since October 2018. As with past surveys, firms have also consistently cited concerns with finding talent.
Raw material costs rose 1.95% at the annual rate in February, a four-month high and up strongly from 1.21% in January, which had been the slowest pace since May 2017. Manufacturers also predict a pickup in input price growth, with respondents expecting an annualized 2.26% increase six months from now, up from 1.51% in the last survey, which was the lowest since July 2017.
- University of Michigan Consumer Sentiment (Revision): The Index of Consumer Sentiment jumped to the highest point since March 2018, or nearly two years. It rose from 99.8 in January to 101.0 in February, according to the University of Michigan and Thomson Reuters. Americans were more upbeat in their economic outlook, with perceptions of current economic conditions also edging higher in February. While the coronavirus outbreak was mentioned by some of the respondents, the survey mostly took place before last week’s steep decline in financial markets. As such, confidence could slip in March data, depending on what transpires over the next couple weeks.
|
|
Thank you for subscribing to the NAM's Monday Economic Report.
If you're part of an NAM member company and not yet subscribed, email us. If you're not an NAM member, become one today!
|
|
|
|
|
|
|
|
|
| Interested in becoming a presenter of the Monday Economic Report? Email us. |
|
| Questions or comments? Email NAM Chief Economist Chad Moutray at [email protected]. |
|
| You received this email because you signed up for the NAM's Monday Economic Report as a part of your NAM membership. |
|
| Unsubscribe |
|
| © 2020 National Association of Manufacturers |
|
 |
|
|
|
|
|
|
|
|
