 |
| If you’re having trouble reading this, click here. |
|
| MONDAY ECONOMIC REPORT |
|
|
|
|
| Essential Takes on Leading Economic Indicators |
|
| By Chad Moutray, Ph.D., CBE – March 9, 2020 – SHARE |
|
|
| |
|
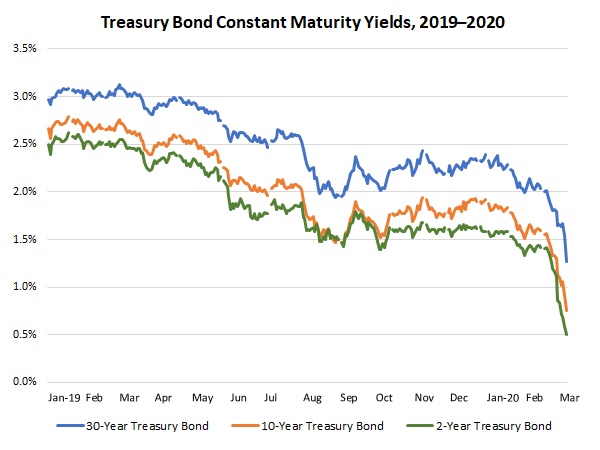
| Outlook Worries Send Rates to Historic Lows Despite Federal Reserve Action |
|
| The Weekly Toplines |
|
- Financial markets continued to be rocked by concerns about the coronavirus outbreak and the negative impacts on economic activity and the outlook. Global equity markets have pushed further into contraction territory, and investors are flocking to the safety of bonds. As a result, Treasury yields and mortgage rates have hit historic new lows. On the positive side, lower rates have led to sharp increases in mortgage applications and refinancing activity.
- The Federal Open Market Committee reduced the target federal funds rate as an emergency response on March 3, suggesting that the Federal Reserve will “use its tools and act as appropriate to support the economy.” The FOMC will meet again March 17–18, and it is expected to reduce interest rates again, perhaps by another 25 basis points.
- The ISM® Manufacturing Purchasing Managers’ Index® stagnated in February, with firms “cautious” amid concerns over the global coronavirus outbreak. The headline index fell from 50.9 in January to 50.1 in February, with new orders dropping into contraction territory (49.8) after rebounding in the previous survey. Production and exports continued to expand despite easing somewhat in February.
- Recent economic data support the view that manufacturing was stabilizing in January and early February before dampening on worries about the coronavirus outbreak, including the construction, employment and factory orders reports released last week.
- Manufacturing employment rebounded by 15,000 in February after falling by 20,000 in January. Over the past five months, the sector has shed 10,000 workers on net. Job growth moving forward will hinge on developments of the coronavirus outbreak and the impact to global markets. Average hourly earnings for production and nonsupervisory workers in manufacturing have risen 2.8% year-over-year.
- Nonfarm payrolls increased by 273,000 in February, matching the solid gain in January. The unemployment rate declined once again to 3.5%, continuing to be the lowest since December 1969. The labor market participation rate was unchanged at 63.4%, remaining the best reading since June 2013.
- New orders for manufactured goods fell 0.5% in January, but excluding defense sales, orders increased 1.3%. Factory orders excluding transportation rose 1.4% year-over-year. Moreover, new orders for core capital goods (or nondefense capital goods excluding aircraft)—a proxy for capital spending in the U.S. economy—increased 1.1% in January, with 0.7% growth over the past 12 months.
- Private manufacturing construction spending rose 1.4% in January. Warmer temperatures and some stabilization in the sector likely helped to prop up activity. Construction activity in the sector has risen 5.0% over the past 12 months, up from $72.78 billion in January 2019.
|
 |
|
| Economic Indicators |
|
Last Week’s Indicators:
(Summaries Appear Below)
Monday, March 2
Construction Spending
ISM® Manufacturing Purchasing Managers’ Index®
Tuesday, March 3
None
Wednesday, March 4
ADP National Employment Report
Thursday, March 5
Factory Orders and Shipments
Productivity and Costs (Revision)
Friday, March 6
BLS National Employment Report
International Trade Report |
|
|
|
This Week's Indicators:
Monday, March 9
None
Tuesday, March 10
NFIB Small Business Survey
Wednesday, March 11
Consumer Price Index
Thursday, March 12
Producer Price Index
Friday, March 13
University of Michigan Consumer Sentiment |
|
|
| Deeper Dive |
|
- ADP National Employment Report: Manufacturing employment fell by 4,000 in February, declining for the sixth time in the past seven months, according to ADP estimates. This reflects the challenges seen in the sector as it grapples with slowing global growth and uncertainties in the marketplace. Along those lines, manufacturers have lost nearly 24,000 workers on net over the past 12 months.
In the larger economy, total nonfarm private employment rose by 183,000 in February, easing a bit from 209,000 in January but still a solid figure overall. On a year-over-year basis, private firms have added more than 157,000 employees per month on average since February 2019. The strongest gains in the latest data occurred in construction; education and health services; leisure and hospitality; professional and business services; and trade, transportation and utilities. In a reversal from past trends, large businesses (i.e., those with 500 or more employees) generated most of the net job creation in February, or 72.7% of the increase in employment for the month.
- BLS National Employment Report: Manufacturing employment rebounded by 15,000 in February after falling by 20,000 in January. This is consistent with stabilization in the sector seen in other data before the current concerns surrounding the coronavirus outbreak. Manufacturers added just more than 5,000 workers per month in 2019, slowing from 22,000 per month in 2018, but over the past five months, the sector has shed 10,000 workers on net. Job growth moving forward will hinge on developments of the coronavirus outbreak and the impact to global markets.
In the latest figures, durable and nondurable goods employment rose by 11,000 and 4,000, respectively. Motor vehicles and parts employment rebounded from January, up 6,800 in February. Other bright spots in the report included chemicals, computers and electronic products, fabricated metal products, nonmetallic mineral products and plastics and rubber products, among others. In contrast, segments with reduced employment included apparel, electrical equipment and appliances, furniture and related products, machinery, paper and paper products, primary metals and wood products.
Average hourly earnings for production and nonsupervisory workers in manufacturing were $22.53 in February, up from $22.43 in January. Over the past 12 months, that represented 2.8% growth year-over-year, up from 2.7% in the previous release but down from 3.4% in July.
In the larger economy, nonfarm payrolls increased by 273,000 in February, matching the solid gain in January. The unemployment rate declined once again to 3.5%, continuing to be the lowest since December 1969. The labor market participation rate was unchanged at 63.4%, remaining the best reading since June 2013.
- Construction Spending: Private manufacturing construction spending rose 1.4% in the latest data, up from $75.43 billion at the annual rate in December to $76.45 billion in January. Much like the residential figures, nonresidential activity likely benefited from warmer temperatures, and the data are also consistent with some stabilization in the manufacturing sector at year’s end. Construction activity in the sector has risen 5.0% over the past 12 months, up from $72.78 billion in January 2019. That is encouraging, but it is worth noting that manufacturing construction activity remains well below the all-time high of $86.65 billion in June 2015.
Meanwhile, total private construction spending increased 1.5% in January, with residential and nonresidential activity up 2.1% and 0.8%, respectively. New single-family construction increased 2.8%, highlighting recent progress in the housing market, but multifamily activity was flat for the month. On a year-over-year basis, private residential and nonresidential construction spending increased 9.0% and 0.5%, respectively. At the same time, public-sector construction rose 2.6% in January, jumping 12.6% over the past 12 months.
- Factory Orders and Shipments: New orders for manufactured goods fell 0.5% in January, pulling back after rising 1.9% in December. Yet, this was skewed by significant declines for defense aircraft and parts and ships and boats. Excluding defense sales, orders increased 1.3%, led by gains in fabricated metal products, machinery, motor vehicles and parts and primary metals. Durable and nondurable goods orders decreased 0.2% and 0.8% in January, respectively, but excluding transportation equipment, durable goods rose 0.8% for the month.
Overall, the manufacturing sector was challenged in 2019 but was showing signs of stabilization at year’s end before the coronavirus outbreak. Factory orders have declined 0.8% since January 2019, but more positively, new orders for manufactured goods excluding transportation rose 1.4% year-over-year. Moreover, new orders for core capital goods (or nondefense capital goods excluding aircraft)—a proxy for capital spending in the U.S. economy—increased 1.1% in January, with 0.7% growth over the past 12 months.
Meanwhile, factory shipments decreased 0.5% in January, reversing the 0.5% gain in December. With transportation equipment excluded, shipments declined 0.3% for the month. Since January 2019, manufactured goods shipments have decreased 0.4%, but with a gain of 1.5% without transportation equipment included. Core capital goods shipments fell 0.3% year-over-year.
- International Trade Report: The U.S. trade deficit decreased from $48.61 billion in December to $45.34 billion in January. Goods exports (down from $137.78 billion to $136.37 billion) and imports (down from $204.17 billion to $203.99 billion) were both lower in the latest data. Exports were pulled lower by reduced sales of non-automotive capital goods and industrial supplies and materials, particularly for civilian aircraft and petroleum. Similarly, goods imports fell on declining activity for automotive vehicles, parts and engines, industrial supplies and materials and non-automotive capital goods. The service-sector trade surplus rose from $20.98 billion to $21.24 billion, a six-month high.
In non-seasonally adjusted data, U.S.-manufactured goods exports totaled $86.25 billion in January, down 2.26% from $88.24 billion in January 2019. This suggests that international demand for U.S.-manufactured goods continued to weaken moving into the new year.
- ISM® Manufacturing Purchasing Managers’ Index®: The Institute for Supply Management® reported that manufacturing activity stagnated in February, with firms “cautious” amid concerns over the global coronavirus outbreak. The headline index fell from 50.9 in January to 50.1 in February, with new orders dropping into contraction territory (49.8) after rebounding in the previous survey. Employment continued to decline, falling for the seventh straight month, and imports, prices and inventories also contracted. On the positive side, production and exports continued to expand despite easing somewhat in February.
The sample comments noted worries about the coronavirus outbreak, with weaker sales and supply chain disruptions in China. Reduced commodity prices also challenged the energy sector. The survey responses likely predated much of the financial market volatility last week, making the next survey highly dependent on developments with the coronavirus and economic conditions between now and the next release on April 1.
- Productivity and Costs (Revision): Manufacturing labor productivity fell 0.8% at the annual rate in the fourth quarter, an improvement from the 1.2% decline estimated earlier and down for the third straight quarter. Output decreased 0.4% in the fourth quarter, instead of the 1.0% rate seen previously. Hourly compensation costs rose 2.8%, and unit labor costs increased 3.6%. Labor productivity for durable and nondurable goods manufacturers decreased 0.9% and 1.2% in the fourth quarter, respectively, with output down 1.4% for durable goods but up 0.8% for nondurable goods firms.
In 2019, labor productivity for manufacturers was flat, down from 0.4% growth in 2018. One of the larger economic concerns has been sluggishness of productivity growth since the Great Recession. Indeed, output per worker in the manufacturing sector averaged -0.2% from 2011 to 2019. In contrast, the average growth rate for the sector registered 3.8% and 4.8% in the 1990–2000 and 2002–2008 time frames, respectively, or the two prior economic recoveries.
Meanwhile, nonfarm business labor productivity rose 1.2% in the fourth quarter, easing slightly from 1.4% in the previous estimate but still bouncing back from a decline of 0.2% in the third quarter. Output increased a modest 2.4% in the fourth quarter, with unit labor costs up 0.9%. For the year, labor productivity for nonfarm businesses rose 1.9% in 2019, up from 1.4% in 2018 and the strongest annual gain since 2010, which was encouraging. For comparison purposes with manufacturing, nonfarm labor productivity averaged 1.1% between 2012 and 2019, but 1.5% over the past three years. Nonfarm labor productivity growth has also decelerated from past trends, which averaged 2.2% and 2.7% in the 1990–2000 and 2002–2008 periods.
|
|
Thank you for subscribing to the NAM's Monday Economic Report.
If you're part of an NAM member company and not yet subscribed, email us. If you're not an NAM member, become one today!
|
|
|
|
|
|
|
|
|
| Interested in becoming a presenter of the Monday Economic Report? Email us. |
|
| Questions or comments? Email NAM Chief Economist Chad Moutray at [email protected]. |
|
| You received this email because you signed up for the NAM's Monday Economic Report as a part of your NAM membership. |
|
| Unsubscribe |
|
| © 2020 National Association of Manufacturers |
|
 |
|
|
|
|
|
|
|
|
