 |
| If you’re having trouble reading this, click here. |
|
| MONDAY ECONOMIC REPORT |
|
|
|
|
| Essential Takes on Leading Economic Indicators |
|
| By Chad Moutray, Ph.D., CBE – March 23, 2020 – SHARE |
|
|
| |
|
| Clues on the Economic Damage from COVID-19 Emerge |
|
| The Weekly Toplines |
|
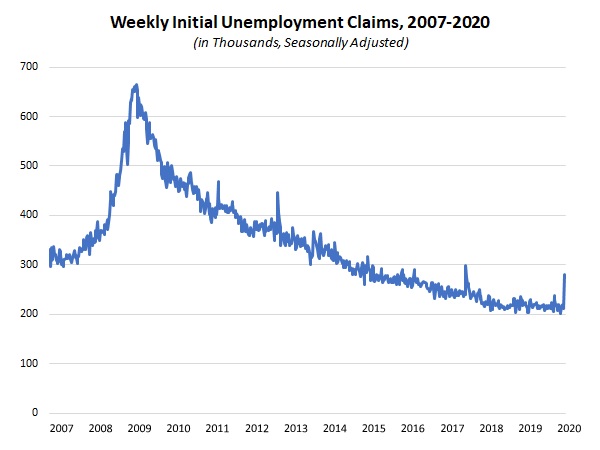
- Weekly initial unemployment claims jumped from 211,000 to 281,000, the highest level since September 2017. This figure will spike dramatically this week, likely approaching 1 million, with more businesses being forced to close or reduce activity and both firms and consumers pulling back on spending outside of the home. The data released last week foreshadowed the economic damage that will likely emerge over the coming weeks.
- Manufacturing activity in the New York and Philadelphia Federal Reserve Bank districts both pulled back sharply in March, quickly ending the signs of stabilization in the sector seen in February’s surveys. In both reports, more than 30% of respondents in March reported that sales had fallen relative to February, nearly double the rate in the previous survey.
- Manufacturing production edged up 0.1% in February after falling 0.2% in January. Prior to the COVID-19 outbreak, the manufacturing sector had stabilized in recent months, albeit with ongoing weaknesses in the United States and globally. Along those lines, manufacturing production has declined 0.4% over the past 12 months, up from being down 1.0% year-over-year in January but with negative year-over-year readings for the eighth straight month.
- Total industrial production increased 0.6% in February, growing for the first time since November. Mining production fell 1.5%, but utilities output rose 7.1% as colder temperatures increased overall usage. Overall, industrial production was flat over the past 12 months, an improvement after declining on a year-over-year basis in the previous five months.
- Retail sales decreased 0.5% in February, pulling back after rising 0.6% in January. While the COVID-19 outbreak likely fueled the decline in sales, it is also clear that March spending figures will reflect an acceleration in that decline. Yet, consumer purchases of goods and services have grown modestly over the past 12 months, up 4.3% since February 2019, but down from 5.0% year-over-year in the previous release.
- Some of the data points released last week likely serve as a more positive snapshot of what the U.S. economy looked like before the COVID-19 outbreak, with every expectation that things have changed materially since then. This includes the following:
- In the most recent NAM Manufacturers’ Outlook Survey, 75.6% of respondents felt positive about their own company’s outlook, up from 67.6% in December, consistent with some improvements in the sector seen earlier in the year. The inability to find talent remained the top challenge for the 10th consecutive quarter.
- Job openings in the manufacturing sector rebounded, up from 360,000 in December to 402,000 in January. There continued to be more job openings nationally than there were people looking for them. Nonetheless, net hiring in manufacturing was negative for the fourth time in the past five months.
- For now, the housing market remains a bright spot, boosted by warmer-than-normal winter temperatures and low mortgage rates.
- New residential construction pulled back 1.5% in February, but at 1,599,000 annualized units, housing starts have soared 39.2% year-over-year. New single-family housing starts jumped from 1,005,000 units to 1,072,000 units, the best reading since June 2007.
- Permits data have also been solid, with builders continuing to be upbeat about sales prospects for the next six months, at least for now.
- Existing home sales rose 6.5%, jumping from an annualized 5.42 million units in January to 5.77 million units in February, with all of that gain from single-family activity. Sales have risen a solid 7.2% over the past 12 months, up from 5.38 million units in February 2019.
|
 |
|
| Economic Indicators |
|
Last Week’s Indicators:
(Summaries Appear Below)
Monday, March 16
New York Fed Manufacturing Survey
State Employment Report
Tuesday, March 17
Industrial Production
Job Openings and Labor Turnover Survey
NAHB Housing Market Index
Retail Sales
Wednesday, March 18
Housing Starts and Permits
Thursday, March 19
Conference Board Leading Indicators
Philadelphia Fed Manufacturing Survey
Friday, March 20
Existing Home Sales |
|
|
|
This Week's Indicators:
Monday, March 23
Chicago Fed National Activity Index
Tuesday, March 24
IHS Markit Flash Manufacturing PMI
New Home Sales
Wednesday, March 25
Durable Goods Orders and Shipments
Thursday, March 26
Gross Domestic Product (Second Revision)
International Trade in Goods (Preliminary)
Friday, March 27
Personal Consumption Expenditures Deflator
Personal Income and Spending
University of Michigan Consumer Sentiment (Revision) |
|
|
| Deeper Dive |
|
- Conference Board Leading Indicators: The Leading Economic Index edged up 0.1% in February, pulling back from the 0.7% gain in January. After stabilizing somewhat in January, new orders for manufactured goods were once again a drag on the LEI, with building permits, the interest rate spread and unemployment claims also pulling the index lower in February. It is likely that these drags will get larger in March, with consumers and firms pulling back on activity in light of the COVID-19 pandemic. With that said, the average workweek for production workers, consumer confidence and lending conditions were bright spots, at least in this release.
Meanwhile, the Coincident Economic Index rose 0.3% in February, improving from the 0.1% increase in January. All CEI components were positive for the month, including industrial production, manufacturing and trade sales, nonfarm payrolls and personal income. As noted below, manufacturing production ticked up 0.1% in February.
- Existing Home Sales: The National Association of Realtors reported that existing home sales rose 6.5%, jumping from an annualized 5.42 million units in January to 5.77 million units in February. The biggest gains for the month were in the South and West, with sales weaker in the Northeast, and the total increase came from single-family activity, which increased from 4.82 million units to 5.17 million units at the annual rate, or 7.3%. Condominium and co-op sales were flat at 600,000 units. Overall, existing home sales have risen a solid 7.2% over the past 12 months, up from 5.38 million units in February 2019.
There were 3.1 months of supply on the market in February, unchanged from January but well below the 3.6 months recorded one year ago. As a result, inventories of existing homes for sale remain low. The median sales price for existing homes has increased 8.0% year-over-year, up to $270,100 in February.
- Housing Starts and Permits: New residential construction pulled back 1.5% in February, but the housing market figures remained solid overall, boosted by warmer-than-normal winter temperatures and lower mortgage rates. Housing starts declined from an annualized 1,624,000 units in January, the strongest reading since December 2006, to 1,599,000 units in February. New single-family housing starts jumped from 1,005,000 units to 1,072,000 units, the best reading since June 2007, whereas multifamily activity, which can be highly volatile from month to month, declined from 619,000 units to 527,000 units. Over the past 12 months, new residential construction has soared 39.2%, with single-family and multifamily housing starts rising 35.4% and 47.6%, respectively, since February 2019.
The housing permits data remained solid, even as activity dropped from 1,550,00 units in January, a pace not seen since March 2007, to 1,464,000 units in February. One cannot help to expect that the COVID-19 outbreak will impact residential construction in the coming months, but as a proxy of future activity, the data suggest some cautious optimism—something also seen among builders themselves (see below).
Much like the starts data, single-family permitting rose from 987,000 units to 1,004,000 units, the highest annual rate since May 2007. Permits for multifamily construction declined from 563,000 units to 460,000 units. Overall, new housing permits have risen 13.8% year-over-year, with single-family permitting up 23.3% over the past 12 months, but multifamily activity down 2.7% year-over-year.
- Industrial Production: Manufacturing production edged up 0.1% in February after falling 0.2% in January. Durable goods production increased 0.3% for the month, but nondurable goods output inched down 0.1%. Prior to the COVID-19 outbreak, the manufacturing sector had stabilized in recent months, and the data continue to reflect some improvements, albeit with ongoing weaknesses in the U.S. and globally. Along those lines, manufacturing production has declined 0.4% over the past 12 months, up from being down 1.0% year-over-year in January but with negative year-over-year readings for the eighth straight month. Manufacturing capacity utilization remained the same in February at 75.0%. To illustrate just how much the sector has slowed since last year, manufacturing capacity utilization registered 76.3% in February 2019.
In February, 11 of the 19 major sectors experienced better production, including apparel and leather; computer and electronic products; electronic equipment and appliances; fabricated metal products; food, beverage and tobacco products; furniture and related products; motor vehicles and parts; and plastics and rubber products, among others. In contrast, output declined for aerospace and miscellaneous transportation equipment; chemicals; machinery; nonmetallic mineral products; petroleum and coal products; primary metals; and textile and product mills.
Meanwhile, total industrial production increased 0.6% in February, growing for the first time since November. Mining production fell 1.5%, but utilities output rose 7.1% as colder temperatures increased overall usage. Overall, industrial production was flat over the past 12 months, an improvement after declining on a year-over-year basis in the previous five months. Total capacity utilization rose from 76.6% in January, the lowest level since September 2017, to 77.0% in February. Much like the manufacturing data, capacity was well below the rate seen one year ago, when utilization registered 78.5%.
- Job Openings and Labor Turnover Survey: Job openings in the manufacturing sector rebounded in January after falling to the lowest level since May 2017 in December. There were 402,000 job openings in the sector in January, up from 360,000 in December, with increases in postings for both durable and nondurable goods firms. Manufacturing job openings have remained elevated over much of 2019, averaging 442,000 per month, including June’s reading (486,000), which was the strongest pace since January 2001.
In the larger economy, nonfarm business job openings increased to a three-month high, up from 6,552,000 in December to 6,963,000 in January. It is noteworthy that the U.S. economy continues to have more nonfarm job openings than the number of people looking for work (5,892,000 in January). There were more than 1 million more job postings than there were unemployed people to fill them. For their part, manufacturing firms continue to cite the inability to find talent as a top concern, even as employment growth and the outlook have softened recently.
Manufacturers hired 326,000 workers in January, down from 334,000 in December. At the same time, separations declined from 342,000 to 339,000. Therefore, net hiring (or hires minus separations) was -13,000 in January, the fourth negative reading in the past five months. Overall, net hiring averaged 1,830 per month over the past 12 months.
- NAHB Housing Market Index: The National Association of Home Builders and Wells Fargo reported that confidence pulled back slightly for the third straight month, with the Housing Market Index down from 74 in February to 72 in March. Despite some slippage, confidence remains not far from December’s reading (76), which was the best since June 1999. NAHB Chief Economist Robert Dietz noted that the responses were largely collected before the recent drop in the stock market, and firms noted supply chain disruptions in the sector related to the coronavirus outbreak. Yet, mortgage rates are also at historic lows, helping to generate more demand.
On that note, builder sentiment remains solid, even with some easing. The index for single-family sales edged down from 81 to 79, and the index for expected single-family sales over the next six months declined from 79 to 75. Those figures suggest healthy sales volumes, both currently and in the outlook.
- New York Fed Manufacturing Survey: Manufacturing activity in the New York Federal Reserve Bank’s district declined at the fastest pace since March 2009, as firms pulled back on activity because of the COVID-19 pandemic. The headline index dropped from 12.9 in February to -21.5 in March, with new orders, shipments, employment and the average employee workweek decreasing for the month. Indeed, one-third of manufacturers in the district reported that orders fell in March, nearly double the rate who said the same thing in February (17.0%). Inventories increased for the second straight month.
Manufacturing optimism about the next six months also diminished notably, with the forward-looking index in the Empire State Manufacturing Survey dropping from 22.9 to 1.2, a level not seen since February 2009. With that said, firms remained cautiously positive about improvements in activity in their outlook, with 46.2% of respondents anticipating higher sales six months from now. In addition, 24.1% and 33.1% expect increased hiring and capital spending, respectively. This would suggest that manufacturers in the New York region expect a rebound moving forward, potentially in the second half of this year.
- Philadelphia Fed Manufacturing Survey: Manufacturing activity declined sharply in March after reaching the best reading in two years in February, as firms pulled back in light of the COVID-19 pandemic. The composite index of general business activity plummeted from 36.7 in February to -12.7 in March, the lowest level since July 2012. New orders declined for the first time since August 2016, with 31.1% citing reduced sales and 15.6% saying that demand had increased. Shipments, employment, the average employee workweek and the prices paid for raw materials each slowed materially.
Meanwhile, the forward-looking index eased from 45.4 in February to 35.2 in March, suggesting some cautious optimism about activity over the next six months. It will be interesting to watch how the recent volatility in financial markets and developments related to the coronavirus outbreak impact the outlook of manufacturers in the district moving forward.
- Retail Sales: Consumer spending decreased 0.5% in February, pulling back after rising 0.6% in January. The COVID-19 outbreak likely fueled the decline in sales. It is also clear that March spending figures will reflect an acceleration in that decline, with business closures and consumers staying closer to home. In February, retail sales declined for building material and garden supplies, clothing and accessories, electronics and appliance stores, food service and drinking places, gasoline stations (largely from reduced prices) and motor vehicles and parts. In contrast, sales rose for miscellaneous store retailers and nonstore retailers.
Despite the reduction in retail spending in February, consumer purchases of goods and services have grown modestly over the past 12 months, up 4.3% since February 2019, but down from 5.0% year-over-year in the previous release.
- State Employment Report: Minnesota created the most net new manufacturing jobs in January, adding 2,500 workers. Other states with positive manufacturing employment growth for the month included Kansas (up 1,500), Kentucky (up 900), South Carolina (up 900), Washington (up 800) and Missouri (up 700). At the same time, North Dakota had the lowest unemployment rate in January at 2.3%.
Florida saw the greatest job gains in the sector over the past 12 months, with manufacturing employment in the state up 7,900 since January 2019. Texas (up 7,000), Arizona (up 2,700), South Carolina (up 2,600) and Maryland (up 2,200) also had the largest year-over-year gains in manufacturing employment nationally. |
|
Thank you for subscribing to the NAM's Monday Economic Report.
If you're part of an NAM member company and not yet subscribed, email us. If you're not an NAM member, become one today!
|
|
|
|
|
|
|
|
|
| Interested in becoming a presenter of the Monday Economic Report? Email us. |
|
| Questions or comments? Email NAM Chief Economist Chad Moutray at [email protected]. |
|
| You received this email because you signed up for the NAM's Monday Economic Report as a part of your NAM membership. |
|
| Unsubscribe |
|
| © 2020 National Association of Manufacturers |
|
 |
|
|
|
|
|
|
|
|
