 |
| If you’re having trouble reading this, click here. |
|
| MONDAY ECONOMIC REPORT |
|
|
|
|
| Essential Takes on Leading Economic Indicators |
|
| By Chad Moutray, Ph.D., CBE – March 30, 2020 – SHARE |
|
|
| |
|
| Off the Charts: Job Losses Spike, Service Sector Shaken Amid COVID-19 |
|
| The Weekly Toplines |
|
- Many economic indicators hit historic and troubling records as the economic damage globally from the COVID-19 pandemic grows. Here are some of the record-breaking numbers from last week:
- Weekly initial unemployment claims soared to 3,283,000 for the week ending March 21, the highest level on record by far. This foreshadows a rapid increase in the unemployment rate, likely jumping from 3.5% in February to 5.5% to 6.0% in March, with sharply higher rates in April.
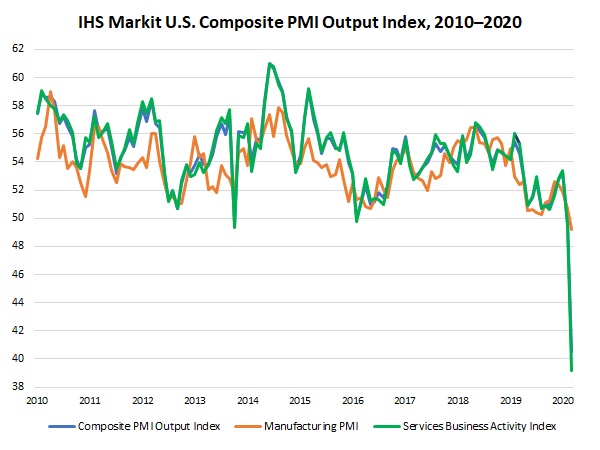
- With many consumer-facing businesses closed and more Americans staying closer to home, the IHS Markit Flash U.S. Services Business Activity Index declined from 49.4 to 39.1, a record low. Service-sector activity also plummeted to new all-time lows in the Eurozone and in the United Kingdom in preliminary data.
- The U.S. manufacturing sector has also been negatively impacted, with March sentiment surveys contracting at rates not seen since the Great Recession.
- The IHS Markit Flash U.S. Manufacturing PMI declined from 50.7 in February to 49.2 in March, the fastest rate since August 2009, as the sector struggles with the COVID-19 outbreak and significant demand and production disruptions.
- Manufacturing activity fell at the fastest pace in 11 years in the latest survey from the Kansas City Federal Reserve Bank, with data contracting across the board. Beyond the COVID-19 challenges, respondents also cited the sharp drop in oil prices, which hit the energy sector in the district hard.
- While activity remained relatively stagnant in March in the Richmond Federal Reserve Bank’s region, manufacturers in the district felt negative in their outlook for the next six months for new orders and shipments.
- Improved motor vehicles and parts demand helped to boost new durable goods orders in February, but excluding transportation equipment, sales fell 0.6% for the month. Core capital goods orders decreased 0.8% in February. Prior to the current crisis, new orders for durable goods have declined 0.1% since February 2019, but excluding transportation equipment, sales have fallen 0.9% year-over-year.
- The Index of Consumer Sentiment from the University of Michigan and Thomson Reuters declined from 101.0 in February to 89.1 in March, the lowest level since April 2016, and is likely to continue to trend lower when the next preliminary data are released on April 9.
- There were more indicators showing that, after a challenging 2019, the U.S. economy had strengthened before the COVID-19 pandemic brought growth to a sudden stop.
- Real GDP grew 2.1% at the annual rate in the fourth quarter, with the U.S. economy growing modestly. In 2019, real GDP rose 2.3%, easing from 2.9% growth in 2018. Obviously, the current crisis has brought that growth to a halt, with the U.S. economy predicted to decline 1.5% in the first quarter and historically sharp decreases forecasted for the second quarter. Still, growth could rebound in the second half of this year once the effects of the coronavirus pandemic start to wane.
- Personal income grew strongly in February, rising 0.6% for the second straight month, with 4.0% growth over the past 12 months. Service-sector spending boosted personal consumption expenditures in February, even as goods purchases declined, with 0.2% growth for the month and a healthy 4.9% increase year-over-year.
- New single-family home sales eased 4.4% in February but remained robust, soaring 14.3% year-over-year. Homebuyers reacted favorably to reduced mortgage rates, a strong labor market and warmer-than-normal winter temperatures.
- The personal consumption expenditures deflator inched up 0.1% in February for the second straight month. Since February 2019, the PCE deflator has risen 1.8%, including at the core level, which excludes food and energy costs. The core PCE deflator has remained below the Federal Reserve’s stated goal of 2.0% core inflation for 16 straight months.
- Especially in light of the current COVID-19 crisis, the Federal Reserve is more concerned with a contracting U.S. and global economy and likely deflationary pressures from a downturn. Indeed, the Federal Reserve has undertaken extraordinary measures in recent weeks to help prop up the economy and to address credit and liquidity concerns in financial markets. With the Federal Reserve aggressively purchasing assets, total assets on its balance sheet soared to $5.25 trillion this week, an all-time high and one that will continue to grow over the next few weeks.
|
 |
|
| Economic Indicators |
|
Last Week’s Indicators:
(Summaries Appear Below)
Monday, March 23
Chicago Fed National Activity Index
Tuesday, March 24
IHS Markit Flash Manufacturing PMI
New Home Sales
Richmond Fed Manufacturing Survey
Wednesday, March 25
Durable Goods Orders and Shipments
Thursday, March 26
Gross Domestic Product (Second Revision)
International Trade in Goods (Preliminary)
Kansas City Fed Manufacturing Survey
Weekly Initial Unemployment Claims
Friday, March 27
Personal Consumption Expenditures Deflator
Personal Income and SpendingUniversity of Michigan Consumer Sentiment (Revision) |
|
|
|
This Week's Indicators:
Monday, March 30
Dallas Fed Manufacturing Survey
Tuesday, March 31
Conference Board Consumer Confidence
Wednesday, April 1
ADP National Employment Report
Construction Spending
ISM® Manufacturing Purchasing Managers’ Index®
Thursday, April 2
International Trade Report
Weekly Initial Unemployment Claims
Friday, April 3
BLS National Employment Report |
|
|
| Deeper Dive |
|
- Chicago Fed National Activity Index: The Chicago Federal Reserve Bank’s National Activity Index rebounded, rising from -0.33 in January to 0.16 in February. This was yet another sign that the U.S. economy had stabilized somewhat prior to the COVID-19 outbreak, with positive readings consistent with growth that is above the historical average. Higher industrial production played a major factor in propping the NAI in February, with manufacturing output edging up 0.1%. Hiring and housing also contributed positively to the February headline index.
Despite the positive reading in the headline index, the three-month moving average for the NAI registered -0.21 in the latest report, and it has been less than zero for 13 straight months, illustrating the challenging economic environment over the past year. While the index was not consistent with an economic downturn in February, which would be associated with a three-month moving average of -0.70 or lower, that will likely change with the March report.
- Durable Goods Orders and Shipments: New durable goods orders increased 1.2% in February, accelerating after edging up 0.1% in January. Motor vehicles and parts demand rose 1.8% for the month, rebounding to the best reading since August. Excluding transportation equipment, new orders for durable goods fell 0.6% in February, reversing the similar gain in January. Looking specifically at the latest data, new orders increased for the above-mentioned automotive sector and for electrical equipment appliances and components, but all other major segments declined in February.
Along those lines, new orders for core capital goods (or nondefense capital goods excluding aircraft)—a proxy for capital spending in the U.S. economy—decreased 0.8% in February, pulling back after rising 1.0% in January. Over the past 12 months, sales of core capital goods have fallen 0.6%.
Overall, the data continue to reflect the challenges in the manufacturing sector over the past year, and more importantly, new orders for durable goods are likely to plummet in March given demand and production disruptions from the COVID-19 outbreak. Prior to the current crisis, new orders for durable goods have declined 0.1% since February 2019, but excluding transportation equipment, sales have fallen 0.9% year-over-year.
Meanwhile, durable goods shipments rose 0.8% in February, but with transportation equipment excluded, shipments fell 0.2% for the month. Since February 2019, durable goods shipments have declined 2.4%, with a decrease of 0.8% over the past 12 months with transportation equipment excluded. Core capital goods shipments decreased 0.7% in February, falling 1.3% year-over-year.
- Gross Domestic Product (Second Revision): The U.S. economy grew 2.1% at the annual rate in the fourth quarter, unrevised from previous estimates and matching the growth rate in the third quarter. The data reflected the economic impacts of global headwinds and trade uncertainties in the fourth quarter, with businesses hesitant to invest in their firms and sizable declines in goods exports and imports, especially the latter. As a result, durable goods and service-sector consumer spending, government expenditures, the housing market and net exports contributed positively to real GDP growth in the fourth quarter, even as consumer purchasing slowed. Nondurable goods spending, nonresidential fixed investment and business inventory spending provided notable drags. In 2019, real GDP rose 2.3%, easing from 2.9% growth in 2018.
Overall, economic growth expanded modestly at the end of last year, albeit at a slower pace than preferred, and there were some signs that activity was stabilizing in January and February before the COVID-19 outbreak. Obviously, the current crisis has brought that growth to a halt, with the U.S. economy predicted to decline 1.5% in the first quarter and historically sharp decreases forecasted for the second quarter. Still, growth could rebound in the second half of this year once the effects of the coronavirus pandemic start to wane.
- IHS Markit Flash U.S. Manufacturing PMI: Manufacturing activity in the United States declined in March at the fastest rate since August 2009 as the sector struggles with the COVID-19 outbreak and significant demand and production disruptions. The headline index decreased from 50.7 in February to 49.2 in March, with new orders, output and employment each falling to the lowest levels since the Great Recession. Exports also remained negative for the third consecutive report. At the same time, with many consumer-facing businesses closed and more Americans staying closer to home, the IHS Markit Flash U.S. Services Business Activity Index declined from 49.4 to 39.1, a record low. Nonetheless, manufacturers felt cautiously positive about modest gains in production six months from now, albeit with the index for future output plummeting from 62.4 to 52.8.
Meanwhile, the IHS Markit Flash Eurozone Manufacturing PMI fell to the lowest level since July 2012, dropping from 49.2 in February to 44.8 in March. As such, the stabilization in activity in the sector on the continent came to an abrupt halt, as manufacturers grapple with disruptions related to the COVID-19 outbreak. The IHS Flash Eurozone Services PMI Activity Index plummeted from 52.6 to 28.4, a new all-time low, with consumers pulling back on spending at restaurants and tourism in light of the “increasingly strict measures” imposed to contain the virus. Manufacturing output in France fell at the quickest pace since March 2009, and in Germany, the sector contracted for the 15th consecutive month.
Outside the European Union, the data were similar in the United Kingdom, with manufacturing production declining at the fastest rate since April 2009 and services activity falling at a record pace.
- International Trade in Goods (Preliminary): In advance statistics, the goods trade deficit fell from $65.90 billion in January to $59.89 billion in February, the lowest level since April 2016. The decline stemmed entirely from a sharp reduction in goods imports, down from $201.76 billion to $196.43 billion, a pace not seen since September 2017. Sizeable declines in imports occurred for capital goods, consumer goods and industrial supplies, which were only partially offset by increased imports for automotive vehicles. In contrast, goods exports rose by $685 million from $135.86 billion to $136.55 billion. Final data will be released April 2, which will also include the service-sector trade surplus.
- Kansas City Fed Manufacturing Survey: Manufacturing activity in the district fell at the fastest pace in 11 years as firms grappled with the COVID-19 outbreak. The composite index decreased from 5 in February to -17 in March, with sizable declines across the board. For instance, 48% of all respondents said that new orders declined in March, nearly double the pace who said the same thing in February. Roughly 73% had “decreased outlooks for business activity and demand for products or services due to the coronavirus outbreak and recent market volatility.” In addition to the challenges presented by COVID-19, the sample comments also cited the sharp drop in oil prices, which hit the energy sector in the district hard.
Turning to the outlook, manufacturers had reduced expectations about growth over the next six months, with the forward-looking composite index dropping from 16 to -19, also the lowest since March 2009. At least half of those completing the survey predict reduced orders, shipments and capital spending over the coming months, with 32% seeing hiring fall. These results suggest the uncertainties in the market related to COVID-19, and if there are signs that the economy might bounce back in the second half of this year, one might expect to see improvements in these measures in future surveys. It is also possible that the data might get worse before then.
- New Home Sales: After rising to the strongest pace in January since May 2007, new single-family home sales eased 4.4% in February, declining from 800,000 units to 765,000 units. Despite a significant boost in the Northeast, reduced sales in the Midwest and West pulled the headline data lower. Overall, new home sales have soared by a robust 14.3% year-over-year, up from 669,000 units in February 2019. Homebuyers reacted favorably to reduced mortgage rates and a strong labor market, and the housing market benefited from warmer-than-normal winter temperatures. With that said, new home sales will likely experience a sizable drop in March, with Americans more anxious in their outlook on COVID-19 fears.
In February, there were 5.0 months of supply on the market, up slightly from 4.8 months in January, which was the lowest inventory level of new homes for sale since November 2017. As such, inventories of new single-family homes for sale remained low in February. The median sales price was $345,900, up 7.8% from the $320,800 median one year ago.
- Personal Consumption Expenditures Deflator: The PCE deflator inched up 0.1% in February for the second straight month. Reduced energy costs, which fell 2.1% in February, helped to keep a lid on price growth for the month despite food costs rising 0.4%. The core PCE deflator, which excludes food and energy prices, increased 0.2% for the third consecutive month. Since February 2019, the PCE deflator has risen 1.8%, the same year-over-year pace as in the previous month. Core inflation also registered 1.8% year-over-year in February, up from 1.7% in January.
Overall, the core PCE deflator has remained below the Federal Reserve’s stated goal of 2.0% core inflation for 16 straight months. As such, inflationary pressures are not a concern for the Federal Open Market Committee currently. Instead, especially in light of the current COVID-19 crisis, the Federal Reserve is more concerned with a contracting U.S. and global economy and likely deflationary pressures from a downturn. Indeed, the Federal Reserve has undertaken extraordinary measures in recent weeks to help prop up the economy and to address credit and liquidity concerns in financial markets.
- Personal Income and Spending: Personal income grew strongly in February, rising 0.6% for the second straight month. This is yet another sign that the U.S. economy was relatively strong before the COVID-19 outbreak. Over the past 12 months, personal income rose 4.0%, a solid figure and the same pace as in the previous release. Manufacturing wages and salaries rose from $908.7 billion in January to $917.3 billion in February.
Personal consumption expenditures increased 0.2% for the second consecutive month in February, boosted by a 0.4% gain in service-sector spending. Yet, goods spending declined 0.3% for the month, with durable and nondurable goods purchases off 0.5% and 0.2%, respectively. On a year-over-year basis, personal spending rose a healthy 4.9%, with durable and nondurable goods sales up 5.9% and 4.3% since February 2019, respectively.
With income growth outpacing spending, the saving rate rose from 7.9% in January to 8.2% in February, an 11-month high. The average saving rate in 2019 registered 7.9%, with 8.8% in February 2019.
- Richmond Fed Manufacturing Survey: Manufacturing activity remained relatively stagnant, with the composite index of general business activity edging up from -2 in February to 2 in March. The underlying data provided mixed results. New orders stabilized, and growth increased for the average workweek, capital spending and shipments. In contrast, the backlog of orders remained negative for the second straight month, and declines occurred for capacity utilization, employment and local business conditions in March. Interestingly, respondents continued to suggest difficulties in finding talent. Looking ahead, manufacturers in the Richmond Federal Reserve’s district felt negative in their outlook for new orders and shipments, likely on challenges related to the COVID-19 outbreak.
Raw material costs rose 1.29% at the annual rate in March, down from 1.95% in February. In addition, manufacturers predict some easing in input price growth moving forward, with respondents expecting an annualized 1.99% increase six months from now, down from 2.26% in the last survey.
- University of Michigan Consumer Sentiment (Revision): The Index of Consumer Sentiment declined from 101.0 in February to 89.1 in March, down from the preliminary estimate of 95.9 and the lowest level since April 2016. In this report, Americans felt less upbeat about both current and future economic conditions in light of COVID-19 concerns and the sharp pullbacks in business activity and in financial markets. The release also included a seven-day moving average chart which suggests that this index will move lower when the preliminary data are released for April. The statement reads, “The extent of additional declines in April will depend on the success in curtailing the spread of the virus and how quickly households receive funds to relieve their financial hardships.” The next survey release, which will be released April 9, will also be the first since the passage of the Coronavirus Aid, Relief and Economic Security (CARES) Act, and consumers could react positively to federal government actions to address the crisis.
- Weekly Initial Unemployment Claims: Weekly initial unemployment claims soared from 282,000 for the week ending March 14 to 3,283,000 for the week ending March 21, the highest level on record by far. For historical context, this figure has never exceeded (since 1967) 700,000 before, including in previous recessions, but it should not be a surprise, with businesses closed or limiting activity in an effort to reduce the spread of COVID-19. Moreover, it is widely expected to rise further this week, with even more workers out of work. In addition, this also foreshadows a rapid increase in the unemployment rate, likely jumping from 3.5% in February to 5.5% to 6.0% in March, with sharply higher rates in April.
|
|
Thank you for subscribing to the NAM's Monday Economic Report.
If you're part of an NAM member company and not yet subscribed, email us. If you're not an NAM member, become one today!
|
|
|
|
|
|
|
|
|
| Interested in becoming a presenter of the Monday Economic Report? Email us. |
|
| Questions or comments? Email NAM Chief Economist Chad Moutray at [email protected]. |
|
| You received this email because you signed up for the NAM's Monday Economic Report as a part of your NAM membership. |
|
| Unsubscribe |
|
| © 2020 National Association of Manufacturers |
|
 |
|
|
|
|
|
|
|
|
