 |
| If you’re having trouble reading this, click here. |
|
| MONDAY ECONOMIC REPORT |
|
|
|
|
| Essential Takes on Leading Economic Indicators |
|
| By Chad Moutray, Ph.D., CBE – April 13, 2020 – SHARE |
|
|
| |
|
| Unemployment Claims Skyrocket to Roughly 10 Million Due to COVID-19 |
|
| The Weekly Toplines |
|
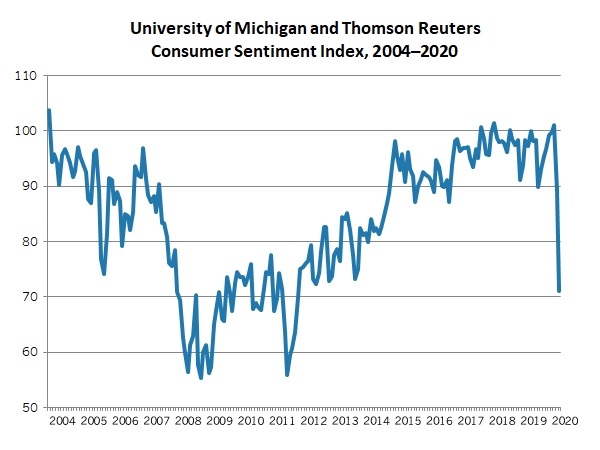
- With Americans negatively impacted by the COVID-19 outbreak, the Index of Consumer Sentiment plummeted to the lowest level since December 2011, falling from 89.1 in March to 71.0 in April, according to preliminary data from the University of Michigan and Thomson Reuters. The drop in the index of current economic conditions was nearly twice the largest monthly decline in the Great Recession (in October 2008).
- There were 6,606,000 initial unemployment claims for the week ending April 4. Nearly 16.8 million Americans filed for unemployment insurance in the past three weeks as the economic toll of the COVID-19 crisis takes hold. As such, the unemployment rate is likely 14–15% right now, a major reversal from the 50-year low in February, which was 3.5%.
- Meanwhile, continuing claims increased from 3,059,000 for the week ending March 21 to 7,455,000 for the week ending March 28 in this report, a new all-time high, surpassing the peak of 6,635,000 during the Great Recession (week ending May 30, 2009).
- The National Federation of Independent Business reported that the Small Business Optimism Index fell below 100—a key threshold consistent with small firm growth—for the first time since November 2016, declining from 104.5 in February to 96.4 in March. Thirteen percent of respondents said the next three months were a “good time to expand,” down from 26% in February and the lowest rate since November 2016.
- Interestingly, the NFIB survey found that difficulties in finding talent remained the top “single most important problem” for 24 straight months, even as hiring has decelerated. That was consistent with the NAM’s recent outlook survey (conducted in late February), which also continued to cite the inability to attract and retain workers as the top challenge.
- Last week’s job openings data provide another “time capsule” view of strength in the labor market before the major disruptions in employment due to the COVID-19 outbreak, with postings in the manufacturing sector up in February. There continued to be more job openings in the U.S. economy in February than the number of people looking for work—a trend that lasted for 24 straight months but ended in March with sharp increases in unemployment.
- The minutes from the Federal Open Market Committee’s March 15 meeting illustrated the extent to which Federal Reserve participants felt extremely worried about the economic damage from the COVID-19 outbreak, leading to the extraordinary monetary policy measures that have been implemented since then. Last week, Federal Reserve Chair Jay Powell outlined how active the Federal Reserve has been in recent weeks to provide a financial backstop and to help lay the groundwork for economic recovery, using its emergency powers in this crisis.
- Along those lines, the Treasury Department and Federal Reserve announced new and expanded lending programs, as authorized by the CARES Act. For details on the new lending facilities, click here.
- The Federal Reserve remains concerned about deflationary pressures from the sharp drop in economic activity due to COVID-19. Consumer and producer prices both declined in March, with the data reflecting changes in behavior related to the crisis, and energy costs pushing both measures lower in the latest release. For its part, core producer price inflation was the slowest since August 2016.
|
 |
|
| Economic Indicators |
|
Last Week’s Indicators:
(Summaries Appear Below)
Monday, April 6
Real GDP by Industry (Fourth Quarter)
Tuesday, April 7
Consumer Credit
Job Openings and Labor Turnover Survey
NFIB Small Business Survey
Wednesday, April 8
None
Thursday, April 9
Producer Price Index
University of Michigan Consumer Sentiment
Weekly Initial Unemployment Claims
Friday, April 10
Consumer Price Index |
|
|
|
This Week's Indicators:
Monday, April 13
None
Tuesday, April 14
None
Wednesday, April 15
Industrial Production
NAHB Housing Market Index
New York Fed Manufacturing Survey
Retail Sales
Thursday, April 16
Housing Starts and Permits
Philadelphia Fed Manufacturing Survey
Weekly Initial Unemployment Claims
Friday, April 17
Conference Board Leading Index
State Employment Report |
|
|
| Deeper Dive |
|
- Consumer Credit: U.S. consumer credit outstanding increased 6.4% in February, picking up from the 3.5% gain in January. Total consumer credit registered $4.226 trillion in February, with $1.096 trillion in revolving credit and $3.129 trillion in nonrevolving credit. Over the past 12 months, consumer credit outstanding has increased 3.1%, with revolving and nonrevolving credit up 2.1% and 3.4% year-over-year, respectively.
Revolving credit (including credit cards and other credit lines) has seesawed of late, declining 2.7% in January and then rising 4.6% in February. More importantly, growth in revolving credit has trended lower over the past 12 months, down from 3.5% year-over-year. This could suggest some anxiousness on the part of the consumer—even before the current financial strains from the COVID-19 outbreak. Meanwhile, nonrevolving credit (including auto and student loans) rose 7.0% in February, up from 5.6% growth in the prior release.
- Consumer Price Index: Consumer prices fell 0.4% in March, the largest monthly decline since January 2015 and led by sharply lower energy costs, which decreased 5.8%. Food prices rose 0.3% in March, with costs for food at home rising 0.5% for the second straight month. Over the past 12 months, the consumer prices index has risen 1.5%, after falling abruptly 2.3% year-over-year in the previous release and a 13-month low. At the same time, core inflation (which excludes food and energy) edged down 0.1% in March, with 2.1% growth over the past 12 months, the slowest pace since June.
The data reflect the effects of the COVID-19 outbreak, with higher costs for grocery items, dramatic declines in gasoline prices (off 10.5% in March) and decreased costs for apparel, new vehicles and transportation services. Indeed, core inflation is likely to decelerate further in April. The current outlook is for consumer prices to decline 0.2% in 2020 relative to 2019. On a year-over-year basis, consumer prices will likely fall at least 1.5% by December relative to 12 months prior.
- Job Openings and Labor Turnover Survey: The job openings data provide another “time capsule” view of strength in the labor market before the major disruptions in employment due to the COVID-19 outbreak. There were 420,000 job openings in the manufacturing sector in February, up for the second straight month from 408,000 in January. Over the past 12 months, job postings remained relatively elevated, averaging more than 435,000 per month, including June’s reading (486,000), which was the strongest pace since January 2001. Hiring also improved for manufacturers, up from 311,000 to 342,000, and separations edged down from 331,000 to 328,000. As a result, there was net hiring of 14,000 in February among manufacturers, rebounding from net losses in the prior two months.
In the larger economy, nonfarm business job openings pulled back from 7,012,000 in January to 6,882,000 in February. With that said, the labor market has shifted dramatically since then. In February, the gap between job openings in the U.S. economy and the number of people looking for work (5,787,000) was nearly 1.1 million. This was a sign of a tight labor market, and the trend of having more job openings than the unemployed existed for 24 straight months. However, that trend ended in March, with the number of people looking for work rising to 7,140,000—a figure that is expected to rise sharply in April. March job openings data will be released May 15.
- NFIB Small Business Survey: The National Federation of Independent Business reported that the Small Business Optimism Index fell below 100—a key threshold consistent with small firm growth—for the first time since November 2016, declining from 104.5 in February to 96.4 in March. The write-up notes that COVID-19 has forced many small business owners to close or reduce their operations, and it describes their outlook as “bleak.” Thirteen percent of respondents said the next three months were a “good time to expand,” down from 26% in February and the lowest rate since November 2016.
The underlying data reflected the downward shift in sentiment. For instance, the net percentage expecting sales growth over the next three months dropped from 19% to -12% in the latest report, and the rate of owners planning to hire in the next three months decreased from 21% to 9%. At the same time, difficulties in finding talent has remained the top “single most important problem” for 24 straight months, even as hiring has decelerated. Thirty-five percent of respondents noted job openings in March, down from 38% in February. On the capital spending front, 21% of small firms anticipate making an expenditure over the next three to six months, down from 26%.
- Producer Price Index: Producer prices for final demand goods and services fell for the second straight month, declining 0.2% in March. More importantly, producer prices for final demand goods dropped 1.0% in March, extending the 0.9% decrease in February. The COVID-19 outbreak disrupting activity led to reduced input costs, with oil price shocks also having a negative impact. Energy costs fell a whopping 6.7% for the month, with food prices flat. Core inflation for goods, which excludes food and energy, increased 0.2% in March, and producer prices for final demand services also rose 0.2% for the month.
Over the past 12 months, producer prices for final demand goods and services decelerated from 2.1% in January, to 1.3% in February, to 0.7% in March, the lowest year-over-year rate since September 2016. Likewise, core producer prices have grown 1.1% year-over-year, slowing from 1.6% and 1.4% in January and February, respectively. That was the slowest pace of core PPI inflation since August 2016.
The Federal Reserve remains concerned about deflationary pressures from the sharp drop in economic activity due to COVID-19, and as such, it has pursued extraordinary monetary policy measures to help prop up the economy—providing a financial “bridge” for consumers and businesses until activity picks back up.
- Real GDP by Industry (Fourth Quarter): Real GDP grew 2.1% at the annual rate in the fourth quarter, as previously reported, the same pace as in the third quarter. According to new data from the Bureau of Economic Analysis, manufacturing subtracted 0.10 percentage points from top-line growth in the fourth quarter, reversing the 0.47 percentage point contribution in the third quarter and pulled lower mainly from nondurable goods activity. Manufacturing accounted for 11.0% of real GDP in the fourth quarter.
Overall, manufacturing value-added output rose 0.7%, up from $2.366 trillion in the third quarter to $2.381 trillion in the fourth quarter, which was an all-time high. In the fourth quarter, value-added output for durable goods increased from $1.345 trillion to $1.348 trillion, a new record, with nondurable goods activity also higher, up from $1.021 trillion to $1.033 trillion. Chemicals; food, beverage and tobacco products; and petroleum and coal products were bright spots, with slight drags from apparel, leather and allied products; nonmetallic mineral products; and primary metals.
With that said, real value-added output in manufacturing inched down from $2.190 trillion in the third quarter to $2.185 trillion in the fourth quarter, as expressed in chained 2012 dollars. Real value-added output for durable goods edged up to a new record high ($1.242 trillion), but the data for nondurable goods declined somewhat.
Along those lines, manufacturing gross output has continued to ease since reaching the record high at the end of 2018 ($6.304 trillion), pulling back 1.0% year-over-year and consistent with the challenges seen in other data for the sector. In the fourth quarter, gross output declined from $6.261 trillion to $6.242 trillion, led by weakness in the durable goods sector. Gross output for nondurable goods rose marginally in the fourth quarter.
- University of Michigan Consumer Sentiment: The Index of Consumer Sentiment plummeted to the lowest level since December 2011, falling from 89.1 in March to 71.0 in April, according to preliminary data from the University of Michigan and Thomson Reuters. A sharp reduction in perceptions about the current economic environment led the decline, with consumers and businesses negatively impacted by the COVID-19 outbreak. The drop in the index of current economic conditions, down from 103.7 to 72.4, was nearly twice the largest monthly decline in the Great Recession (in October 2008). Assessments of the outlook for the next six months also decreased, but less drastic. Final numbers will be released April 24.
- Weekly Initial Unemployment Claims: There were 6,606,000 initial unemployment claims for the week ending April 4, building on the 6,867,000 claims added for the week ending March 28. These are unprecedented levels, suggesting that nearly 16.8 million Americans filed for unemployment insurance in the past three weeks as the economic toll of the COVID-19 crisis takes hold. As such, the unemployment rate is likely 14–15% right now, a major reversal from the 50-year low in February, which was 3.5%.
California, Georgia, Illinois, Michigan, New Jersey, New York, Ohio, Pennsylvania and Texas each had at least 200,000 initial unemployment claims in the latest week, with 23 states having new claims that exceeded 100,000. Many of these states cited manufacturing.
Meanwhile, continuing claims increased from 3,059,000 for the week ending March 21 to 7,455,000 for the week ending March 28 in this report, a new all-time high, surpassing the peak of 6,635,000 during the Great Recession (week ending May 30, 2009). The latest figure suggests that 5.1% of the workforce received unemployment insurance that week, a rate that will increase substantially given the initial claims data.
|
|
Thank you for subscribing to the NAM's Monday Economic Report.
If you're part of an NAM member company and not yet subscribed, email us. If you're not an NAM member, become one today!
|
|
|
|
|
|
|
|
|
| Interested in becoming a presenter of the Monday Economic Report? Email us. |
|
| Questions or comments? Email NAM Chief Economist Chad Moutray at [email protected]. |
|
| You received this email because you signed up for the NAM's Monday Economic Report as a part of your NAM membership. |
|
| Unsubscribe |
|
| © 2020 National Association of Manufacturers |
|
 |
|
|
|
|
|
|
|
|
