 |
| If you’re having trouble reading this, click here. |
|
| MONDAY ECONOMIC REPORT |
|
|
|
|
| Essential Takes on Leading Economic Indicators |
|
| By Chad Moutray, Ph.D., CBE – April 20, 2020 – SHARE |
|
|
| |
|
| Industrial Production Had Largest Monthly Decline Since January 1946 |
|
| The Weekly Toplines |
|
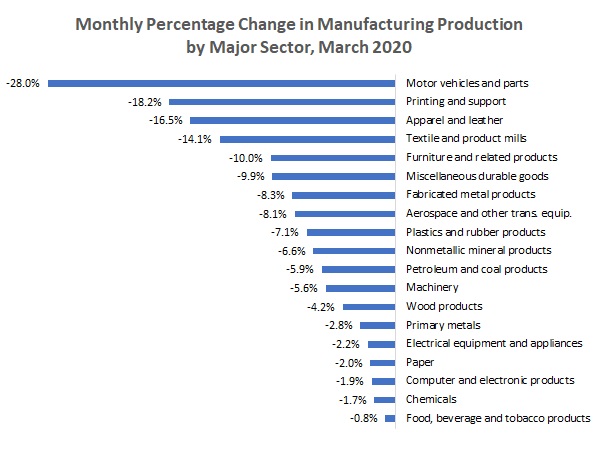
- Manufacturing production fell sharply by 6.3% in March as firms grappled with the COVID-19 outbreak, including closures, reduced activity and significant supply and demand disruptions globally. Durable and nondurable goods production decreased 9.1% and 3.2% in March, respectively, with all 19 major sectors experiencing declines (see the graphic below).
- On a year-over-year basis, manufacturing production has declined 6.6%. Manufacturing capacity utilization plummeted from 75.0% in February to 70.3% in March, the lowest rate since May 2010. Meanwhile, total industrial production decreased 5.4% in March, the largest monthly decline since January 1946.
- The current outlook is for production in the sector to decline 12% between February and May before starting to rebound in June and beyond. However, the economic damage will take some time for manufacturing to fully recover from, with production down 6.5% in 2020.
- The New York and Philadelphia Federal Reserve Banks reported sharply reduced activity in their districts in April, with more than 70% of respondents in both reports noting decreased orders for the month. With that said, respondents in both reports felt cautiously optimistic for a rebound over the next six months.
- With Americans under stay-at-home orders nationwide, retail sales plummeted 8.7% in March, the largest monthly decline since the series began in 1992. The extent of the decline in retail spending in March was mind-blowing, particularly in some sectors (see more details below), but there were also some bright spots. Over the past 12 months, retail spending has declined 6.2%, but with motor vehicles and gasoline station sales excluded, retail sales eked out a 0.2% year-over-year gain.
- New housing starts fell 22.3% in March, down from an annualized 1,564,000 units in February to 1,216,000 units, an eight-month low. Over the past 12 months, new housing starts have risen 1.4%, with single-family starts up 2.8% but multifamily activity down 1.6% since March 2019. Housing permits eased to the slowest rate since July, declining from 1,452,000 units at the annual rate in February to 1,353,000 units in March.
- Nonetheless, builder confidence plummeted to the lowest level since June 2014 on worries that residential construction and sales will be severely impacted by the worsening in economic conditions due to the COVID-19 pandemic. New housing starts and permits will also likely move lower in April, perhaps closer to 1 million units at the annual rate, before hopefully rebounding in subsequent months.
- There were 5,245,000 initial unemployment claims for the week ending April 11, building on the 6,615,000 claims added for the week ending April 4. These are unprecedented levels, suggesting that 22 million Americans filed for unemployment insurance in the past four weeks as the economic toll of the COVID-19 crisis takes hold. At the same time, continuing claims increased from 7,446,000 for the week ending March 28 to 11,976,000 for the week ending April 4 in this report, a new all-time high. The latest figure suggests that 8.2% of the workforce received unemployment insurance that week, a rate that will increase substantially given the initial claims data.
- The current expectation is for the unemployment rate to peak around 15% in May, up from the 50-year low in February, which was 3.5%. With that said, if all the 22 million who filed for unemployment insurance over the past few weeks were to receive it (and not all qualify), the current data would be consistent with roughly 18%. That makes the continuing claims number more important moving forward in estimating the employment outlook.
|
 |
|
| Economic Indicators |
|
Last Week’s Indicators:
(Summaries Appear Below)
Monday, April 13
None
Tuesday, April 14
None
Wednesday, April 15
Industrial Production
NAHB Housing Market Index
New York Fed Manufacturing Survey
Retail Sales
Thursday, April 16
Housing Starts and Permits
Philadelphia Fed Manufacturing Survey
Weekly Initial Unemployment Claims
Friday, April 17
Conference Board Leading Index
State Employment Report |
|
|
|
This Week's Indicators:
Monday, April 20
Chicago Fed National Activity Index
Tuesday, April 21
Existing Home Sales
Wednesday, April 22
None
Thursday, April 23
IHS Markit Flash U.S. Manufacturing PMI
Kansas City Fed Manufacturing Survey
New Home Sales
Weekly Initial Unemployment Claims
Friday, April 24
Durable Goods Orders and Shipments
University of Michigan Consumer Sentiment (Revision) |
|
|
| Deeper Dive |
|
- Conference Board Leading Indicators: The Leading Economic Index fell 6.7% in March, the steepest decline in the survey’s 60-year history. The largest decline in the index came from weekly unemployment claims, which have soared to historic and unprecedented levels (see below) and alone contributed 5.5% to the decline in the headline index. Other drags came from the average workweek of production workers, building permits, consumer confidence, new manufacturing orders and the stock market. The interest rate spread provided a slight positive contribution to the LEI for the month.
Meanwhile, the Coincident Economic Index declined 0.9% in March. Declines in industrial production and nonfarm payrolls were enough to offset positive contributions from manufacturing and trade sales and personal income in the latest CEI data.
- Housing Starts and Permits: New residential construction fell 22.3% in March, as the housing market slowed materially in light of the COVID-19 outbreak. Housing starts declined from an annualized 1,564,000 units in February to 1,216,000 units in March, an eight-month low. This was a significant shift, particularly relative to January’s pace (1,619,000 units), which was the strongest since December 2006. New single-family housing starts decreased from 1,037,000 units to 856,000 units, and multifamily residential construction dropped from 527,000 units to 360,000 units for the month. Over the past 12 months, new housing starts eked out a 1.4% gain, with single-family starts up 2.8% but multifamily activity down 1.6% since March 2019.
Meanwhile, housing permits declined from 1,452,000 units at the annual rate in February to 1,353,000 units in March, the slowest rate since July. While this figure continues to be relatively solid, despite pulling back for the second straight month from nearly a 13-year high, one cannot help but expect further deterioration in April. Single-family permitting decreased from 1,005,000 units to 884,000 units, a six-month low, but multifamily activity increased from 447,000 units to 469,000 units. On a year-over-year basis, housing permits rose 5.0%, boosted by an 8.7% increase in single-family permitting over the past 12 months.
Nonetheless, builder confidence has already plummeted to the lowest level since June 2014 (see below) on worries that residential construction and sales will be severely impacted by the worsening in economic conditions. New housing starts and permits will also likely move lower in April, perhaps closer to 1 million units at the annual rate, before hopefully rebounding in subsequent months.
- Industrial Production: Manufacturing production fell sharply by 6.3% in March as firms grappled with the COVID-19 outbreak, including closures, reduced activity and significant supply and demand disruptions globally. Durable and nondurable goods production decreased 9.1% and 3.2% in March, respectively, with all 19 major sectors experiencing declines. The largest output decreases for the month included motor vehicles and parts (down 28.0%), printing and support (down 18.2%), apparel and leather (down 16.5%), textile and product mills (down 14.1%), furniture and related products (down 10.0%), miscellaneous durable goods (down 9.9%), fabricated metal products (down 8.3%) and aerospace and miscellaneous transportation equipment (down 8.1%).
On a year-over-year basis, manufacturing production has declined 6.6%, with durable and nondurable goods output down 9.6% and 3.1%, respectively. Manufacturing capacity utilization plummeted from 75.0% in February to 70.3% in March, the lowest rate since May 2010.
With COVID-19 continuing to challenge manufacturers, the current outlook is for production in the sector to decline 12% between February and May before starting to rebound in June and beyond. However, the economic damage will take some time for manufacturing to fully recover from, with production down 6.5% in 2020.
Meanwhile, total industrial production decreased 5.4% in March, with mining and utilities production off 2.0% and 3.9%, respectively. Total capacity utilization dropped from 77.0% in February to 72.7% in March, a rate not seen since April 2010.
- NAHB Housing Market Index: The National Association of Home Builders and Wells Fargo reported that confidence dropped to the lowest level since June 2012, with the largest monthly drop since the survey began in 1985. The Housing Market Index fell from 72 in March to 30 in April. HMI data below 50 suggest that more builders are negative in their outlook than positive, and it was the first sub-50 reading since June 2014. Despite the sharp decline in sentiment, NAHB Chief Economist Robert Dietz sounded a hopeful note in the outlook. He said, “While the virus is severely disrupting residential construction and the overall economy, the need and demand for housing remains acute. . . . we expect that housing will play its traditional role of helping to lead the economy out of a recession later in 2020.”
Nonetheless, the index for single-family home sales over the next six months declined from 75 to 36, suggesting that survey respondents remained somewhat pessimistic in their sales growth outlook for the coming months. A lot will hinge on how quickly the economy and the housing market will bounce back after the steep drop in confidence in April.
- New York Fed Manufacturing Survey: Eighty-five percent of manufacturers in the New York Federal Reserve Bank’s district reported that business conditions worsened in April, with firms severely challenged by the COVID-19 outbreak. The composite index of business conditions fell from -21.5 in March to -78.2 in April, the lowest reading since the survey began in July 2001, with sharp contractions in new orders, shipments, employment and the average employee workweek. The drop in new orders was typical, with 76.6% of respondents saying that sales had decreased in April, more than doubling the 33.5% who said the same thing in March.
Despite the historic declines seen in the current economic environment, manufacturers in the Empire State Manufacturing Survey felt cautiously positive that activity would rebound over the next six months. Nearly half, for instance, expected new orders and shipments to rise moving forward, with 32.2% anticipating more employment. Capital spending was the exception, with roughly one-third predicting declines in capital expenditures over the coming months. With that said, the forward-looking composite index, which rose from 1.2 to 7.0 in this release, remained at levels not seen since February and March 2009.
- Philadelphia Fed Manufacturing Survey: Manufacturing activity in April declined at the worst pace since July 1980 as firms in the Philly Fed district remained severely challenged by the COVID-19 pandemic. The composite index of general business activity plummeted from -12.7 in March to -56.6 in April, with underlying data lower across the board. More than 70% of respondents said that new orders were lower in April than in March, with no one suggesting that sales increased. Roughly 47% also reported reduced employment.
Yet, the forward-looking index rose from 35.2 in March to 43.0 in April, suggesting some cautious optimism for a rebound in activity over the next six months in the region. For instance, 54.7% expect orders to rise over the coming months, with 18.2% predicting declines. Similarly, 34.7% and 28.2% see higher employment and capital spending, respectively, in their forecasts for the next six months.
- Retail Sales: With Americans under stay-at-home orders nationwide, consumer spending plummeted 8.7% in March, the largest monthly decline since the series began in 1992. The previous record was a 3.9% drop in retail sales in November 2008 during the Great Recession. The extent of the decline in retail spending in March was mind-blowing, with the largest decreases in clothing and accessory stores (down 50.5%), furniture and home furnishing stores (down 26.8%), food services and drinking places (down 26.5%), motor vehicle and parts dealers (down 25.6%), sporting goods and hobby stores (down 23.3%), department stores (down 19.7%), gasoline stations (down 17.2%), electronics and appliance stores (down 15.1%) and miscellaneous store retailers (down 14.3%).
In contrast, there were some bright spots. Food and beverage stores (up 25.6%), general merchandise stores (up 6.4%, or up 12.2% with department stores excluded), health and personal care stores (up 4.3%) and nonstore retailers (up 3.1%) each had increased retail sales in March.
Excluding motor vehicles and gasoline station sales, March retail sales fell 3.1%, with prices for gasoline (as well as its demand) down sharply. Over the past 12 months, retail spending has declined 6.2%, but with motor vehicles and gasoline station sales excluded, retail sales have eked out a 0.2% gain since March 2019.
- State Employment Report: Alabama created the most net new manufacturing jobs in March, adding 2,300 workers. At the other end of the spectrum, the largest declines in employment in March were in Texas (down 7,600), California (down 5,300), Missouri (down 3,100), Indiana (down 2,600), Pennsylvania (down 2,500) and North Carolina (down 2,300).
The national unemployment rate rose from 3.5% in February to 4.4% in March, with Hawaii, Idaho, New Hampshire and South Carolina each having the lowest rate in the country at 2.6% for the month. The highest unemployment rates in the United States in March were in Louisiana (6.9%), Nevada (6.3%), West Virginia (6.1%), the District of Columbia (6.0%) and Pennsylvania (6.0%).
- Weekly Initial Unemployment Claims: There were 5,245,000 initial unemployment claims for the week ending April 11, building on the 6,615,000 claims added for the week ending April 4. These are unprecedented levels, suggesting that 22 million Americans filed for unemployment insurance in the past four weeks as the economic toll of the COVID-19 crisis takes hold. California, Georgia, Michigan, New York, Pennsylvania and Texas each had at least 200,000 initial unemployment claims in the latest week, with 17 states having new claims that exceeded 100,000. Many of these states cited manufacturing.
Meanwhile, continuing claims increased from 7,446,000 for the week ending March 28 to 11,976,000 for the week ending April 4 in this report, a new all-time high. The latest figure suggests that 8.2% of the workforce received unemployment insurance that week, a rate that will increase substantially given the initial claims data.
The current expectation is for the unemployment rate to peak around 15% in May, up from the 50-year low in February, which was 3.5%. With that said, if all the 22 million who filed for unemployment insurance over the past few weeks were to receive it (and not all qualify), the current data would be consistent with roughly 18%. That makes the continuing claims number more important moving forward in estimating the employment outlook.
|
|
Thank you for subscribing to the NAM's Monday Economic Report.
If you're part of an NAM member company and not yet subscribed, email us. If you're not an NAM member, become one today!
|
|
|
|
|
|
|
|
|
| Interested in becoming a presenter of the Monday Economic Report? Email us. |
|
| Questions or comments? Email NAM Chief Economist Chad Moutray at [email protected]. |
|
| You received this email because you signed up for the NAM's Monday Economic Report as a part of your NAM membership. |
|
| Unsubscribe |
|
| © 2020 National Association of Manufacturers |
|
 |
|
|
|
|
|
|
|
|
