 |
| If you’re having trouble reading this, click here. |
|
| MONDAY ECONOMIC REPORT |
|
|
|
|
| Essential Takes on Leading Economic Indicators |
|
| By Chad Moutray, Ph.D., CBE – April 27, 2020 – SHARE |
|
|
| |
|
| Global Growth Grinds to an Unprecedented Halt, Especially for Services |
|
| The Weekly Toplines |
|
- Economic data released last week provided continued signs that economic growth has ground to an abrupt and unprecedented halt, both in the United States and globally.
- The IHS Markit Flash U.S. Manufacturing PMI declined in April at the fastest rate since March 2009 as the sector struggles with the COVID-19 outbreak and significant demand and production disruptions. At the same time, with many consumer-facing businesses closed and more Americans staying closer to home, the IHS Markit Flash U.S. Services Business Activity Index declined from 39.8 to 27.0, a record low.
- Similarly, Eurozone manufacturing activity also fell at the fastest rate since early 2009, with the IHS Flash Eurozone Services PMI Activity Index plummeting from 26.4 to 11.7, a new jaw-dropping record low.
- In the Kansas City Federal Reserve Bank’s district, manufacturers reported the strongest decline in activity in the survey’s history, which dates to 1994, mirroring dismal releases from the New York and Philadelphia Federal Reserve Banks in the prior week. (Regional surveys from the Dallas and Richmond Federal Reserve Banks will be released this week.)
- Existing and new home sales fell 8.5% and 15.4% in March, respectively. Indeed, the housing market—a bright spot in the economy just two months ago—has slowed materially due to the COVID-19 outbreak, just like other segments of the economy.
- The Index of Consumer Sentiment plummeted to the lowest level since December 2011, falling from 89.1 in March to 71.8 in April, according to the University of Michigan and Thomson Reuters.
- New durable goods orders also reflected weaknesses due to COVID-19, but the declines were not as deep as feared, particularly with transportation (and defense) goods excluded.
- Durable goods orders fell 14.4% in March, the largest monthly decline since August 2014. Sharp drops in motor vehicles and parts and nondefense aircraft and parts orders pulled the data lower. Excluding transportation equipment, new orders declined 0.2% in March. Over the past 12 months, new orders for durable goods have dropped 16.0%, or with transportation equipment excluded, sales have fallen 0.7% since March 2019.
- Nondefense capital goods excluding aircraft—a proxy for capital spending in the U.S. economy—edged up 0.1% in March. That surprising result would likely foretell weaker data in April, with manufacturers challenged by the COVID-19 outbreak and this report possibly capturing just the beginning of the declines in activity. Still, core capital goods orders have also declined 0.7% year-over-year.
- There were 4,427,000 initial unemployment claims for the week ending April 18, with 26.45 million Americans filing for unemployment insurance in the past five weeks as the economic toll of the COVID-19 crisis takes hold. Meanwhile, there were 15,976,000 continuing unemployment claims for the week ending April 11 in this report, a new all-time high. The latest figure suggests that 11% of the workforce received unemployment insurance that week, a rate that will continue to increase substantially given the initial claims data.
- With that said, the unemployment rate could easily exceed 20% if all who filed for unemployment insurance over the past few weeks were to receive it. That makes for a shocking turn of events in the labor market following February’s 50-year low, which registered 3.5%.
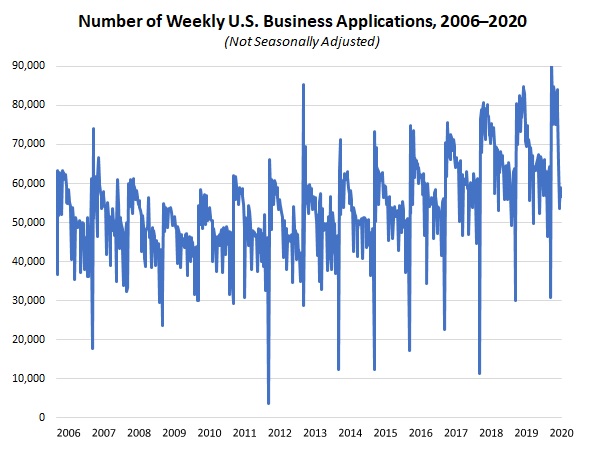
- There were 56,550 applications for new businesses for week 16 of this year, down from 58,900 for week 15. More importantly, applications were down 20.1% relative to the same week in 2019, reflecting the weaker current economic environment. The data, which are part of a new experimental series developed by the Census Bureau, are quite choppy from week to week, as can be seen in the attached graph. Yet, the recent trend is clear: applications averaged 76,527 per week for the first 10 weeks of 2020 but have averaged 61,210 each week since then.
|
 |
|
| Economic Indicators |
|
Last Week’s Indicators:
(Summaries Appear Below)
Monday, April 20
Chicago Fed National Activity Index
Tuesday, April 21
Existing Home Sales
Wednesday, April 22
None
Thursday, April 23
IHS Markit Flash U.S. Manufacturing PMI
Kansas City Fed Manufacturing Survey
New Home Sales
Weekly Initial Unemployment Claims
Friday, April 24
Durable Goods Orders and Shipments
University of Michigan Consumer Sentiment (Revision) |
|
|
|
This Week's Indicators:
Monday, April 27
Dallas Fed Manufacturing Survey
Tuesday, April 28
Conference Board Consumer Confidence
International Trade in Goods (Preliminary)
Richmond Fed Manufacturing Survey
Wednesday, April 29
Business Employment Dynamics
FOMC Monetary Policy Statement
Gross Domestic Product (First Quarter)
Thursday, April 30
Employment Cost Index
Personal Consumption Expenditures Deflator
Personal Income and Spending
Weekly Initial Unemployment Claims
Friday, May 1
Construction Spending
ISM® Manufacturing Purchasing Managers’ Index® |
|
|
| Deeper Dive |
|
- Chicago Fed National Activity Index: The Chicago Federal Reserve Bank’s National Activity Index plunged to the lowest reading since January 2009, down from 0.06 in February to -4.19 in March. The three-month moving average for the NAI registered -1.47 in March, down from -0.20 in February. It was the 14th straight month with the three-month moving average below zero, suggesting growth below the historical trend, and readings at -0.70 or lower are consistent with the U.S. economy being in a recession. As such, the data reflect the abrupt shift in economic activity over the past month as a result of the COVID-19 outbreak as the economy has fallen into a severe recession.
Employment and production pulled the NAI down sharply in March. Manufacturing production fell 6.3% for the month as firms closed, had reduced activity and experienced significant supply and demand disruptions. At the same time, more than 26 million Americans have filed for unemployment insurance over the past five weeks (see below). Those two factors alone accounted for virtually all of the decline to the headline index in March.
- Durable Goods Orders and Shipments: New orders for durable goods fell 14.4% in March, the largest monthly decline since August 2014. Sharp drops in motor vehicles and parts and nondefense aircraft and parts orders pulled the data lower. Excluding transportation equipment, new orders declined 0.2% in March, pulled lower by reduced sales for computers and related products, fabricated metal products, machinery and primary metals. In contrast, orders rose for defense aircraft and parts, electrical equipment, appliances and components and other durable goods.
Nondefense capital goods excluding aircraft—a proxy for capital spending in the U.S. economy—edged up 0.1% in March. That surprising result would likely foretell weaker data in April, with manufacturers challenged by the COVID-19 outbreak and this report possibly capturing just the beginning of the declines in activity.
Over the past 12 months, new orders for durable goods have dropped 16.0%, or with transportation equipment excluded, sales have fallen 0.7% since March 2019. Core capital goods orders have also declined 0.7% year-over-year.
Meanwhile, shipments of durable goods decreased 4.5% in March, with a decline of 0.3% without transportation equipment included. Since March 2019, durable goods shipments have fallen 6.5%, and excluding transportation, shipments have declined 0.7% year-over-year. At the same time, core capital goods shipments for durable goods have decreased 1.0% over the past 12 months.
- Existing Home Sales: The National Association of Realtors reported that existing home sales fell 8.5%, declining from an annualized 5.76 million units in February to 5.27 million units in March, an 11-month low, as the residential market slowed materially due to the COVID-19 pandemic. The biggest decreases for the month occurred in the South and West, but activity also weakened in the Midwest and Northeast. In March, single-family and condominium and co-op sales fell 8.1% and 11.7%, respectively. Over the past 12 months, existing home sales have increased 0.8%, with single-family demand up 1.3% year-over-year but condo and co-op activity down 3.6% since March 2019.
There were 3.4 months of supply on the market in March, up from 3.0 months in February but down from 3.8 months one year ago. As a result, inventories of existing homes for sale remain low. The median sales price for existing homes has increased 8.0% year-over-year, up to $282,500 in March.
- IHS Markit Flash U.S. Manufacturing PMI: Manufacturing activity in the United States declined in April at the fastest rate since March 2009 as the sector struggles with the COVID-19 outbreak and significant demand and production disruptions. The headline index decreased from 48.5 in March to 36.9 in April, with exports and output falling at record paces and new orders and employment declining at the fastest rate since early 2009. At the same time, with many consumer-facing businesses closed and more Americans staying closer to home, the IHS Markit Flash U.S. Services Business Activity Index declined from 39.8 to 27.0, a record low.
Meanwhile, the IHS Markit Flash Eurozone Manufacturing PMI also fell at the fastest rate since February 2009, dropping from 44.5 in March to 33.6 in April as firms continue to grapple with disruptions from the COVID-19 outbreak. In addition, the IHS Flash Eurozone Services PMI Activity Index plummeted from 26.4 to 11.7, a new jaw-dropping record low that illustrates the extent to which business activity has ground to an abrupt halt on the European continent. Manufacturers in France reported a new all-time low in activity, with German manufacturing leaders citing their weakest data since March 2009. Outside of the European Union, survey respondents in the United Kingdom reported that they also had new record lows in activity, especially for new orders and output and for services.
- Kansas City Fed Manufacturing Survey: Manufacturing activity in the district fell at the fastest pace in the survey’s history, which dates to 1994, as firms grappled with the COVID-19 outbreak. The composite index fell from -17 in March to -30 in April, with sizable declines across the board. For instance, 69% of all respondents said new orders declined in April, up from 48% who said the same thing in March. Illustrating the immense cash flow challenges facing many manufacturers, two-thirds of the survey respondents said they had applied for a Small Business Administration Paycheck Protection Program loan. In addition, more than 37% reported having drawn down cash reserves, and 28% made increased use of a credit line or took out a new loan.
Turning to the outlook, manufacturers continued to have negative expectations about growth over the next six months, albeit with the forward-looking composite index rising from -19 to -6. The sample comments highlight uncertainties in the outlook, especially on the duration of COVID-19-related shutdowns and the timing of any economic recovery. In terms of responses, 47% of business leaders in the region anticipate production to decline over the coming months, with 37% predicting increased output and 16% seeing no change.
- New Home Sales: New single-family home sales fell 15.4% from 741,000 units in February to 627,000 units in March, a 10-month low. With Americans sheltering in place across the country, residential sales activity naturally slowed and will likely continue to ease in April and May. In March, sales declined in every region, but especially in the Northeast and West. Over the past 12 months, new home sales have dropped 9.5%, down from 693,000 in March 2019 and well below the 777,000 units being sold in January, which had been the strongest pace since July 2007. Indeed, the housing market—a bright spot in the economy just two months ago—has slowed materially due to the COVID-19 outbreak, just like other segments of the economy.
There were 6.4 months of supply of new homes on the market in March, up sharply from 5.2 months in February and a 10-month high. The median sales price was $321,400, up 3.5% from the $310,600 median one year ago.
- University of Michigan Consumer Sentiment (Revision): The Index of Consumer Sentiment plummeted to the lowest level since December 2011, falling from 89.1 in March to 71.8 in April, according to the University of Michigan and Thomson Reuters. That was a slight improvement from the preliminary estimate of 71.0 reported earlier, but it continued to reflect a sharp reduction in perceptions about the current economic environment, with the COVID-19 outbreak negatively impacting consumers and businesses. Americans felt less upbeat about both current and future economic conditions, with the largest drop seen in assessments of the current climate.
- Weekly Initial Unemployment Claims: There were 4,427,000 initial unemployment claims for the week ending April 18, down from the 5,237,000 claims added for the week ending April 11. These are unprecedented levels, suggesting that 26.45 million Americans filed for unemployment insurance in the past five weeks as the economic toll of the COVID-19 crisis takes hold. California, Florida, Georgia, New York and Texas each had at least 200,000 initial unemployment claims in the latest week, with 13 states having new claims that exceeded 100,000.
Meanwhile, continuing claims increased from 11,912,000 for the week ending April 4 to 15,976,000 for the week ending April 11 in this report, a new all-time high. The latest figure suggests that 11% of the workforce received unemployment insurance that week, a rate that will continue to increase substantially given the initial claims data.
With that said, the unemployment rate could easily exceed 20% if all who filed for unemployment insurance over the past few weeks were to receive it. That makes for a shocking turn of events in the labor market following February’s 50-year low, which registered 3.5%.
|
|
Thank you for subscribing to the NAM's Monday Economic Report.
If you're part of an NAM member company and not yet subscribed, email us. If you're not an NAM member, become one today!
|
|
|
|
|
|
|
|
|
| Interested in becoming a presenter of the Monday Economic Report? Email us. |
|
| Questions or comments? Email NAM Chief Economist Chad Moutray at [email protected]. |
|
| You received this email because you signed up for the NAM's Monday Economic Report as a part of your NAM membership. |
|
| Unsubscribe |
|
| © 2020 National Association of Manufacturers |
|
 |
|
|
|
|
|
|
|
|
