 |
| If you’re having trouble reading this, click here. |
|
| MONDAY ECONOMIC REPORT |
|
|
|
|
| Essential Takes on Leading Economic Indicators |
|
| By Chad Moutray, Ph.D., CBE – May 26, 2020 – SHARE |
|
<
|
|
|
| Some Encouraging Bounce-Backs in Activity, but with Ongoing Weaknesses |
|
| The Weekly Toplines |
|
- While the economic data continue to reflect ongoing, sharp disruptions in demand and operations for manufacturers, there were also signs that the worst of those decreases occurred in late March and in April, with the rate of declines in May improving somewhat.
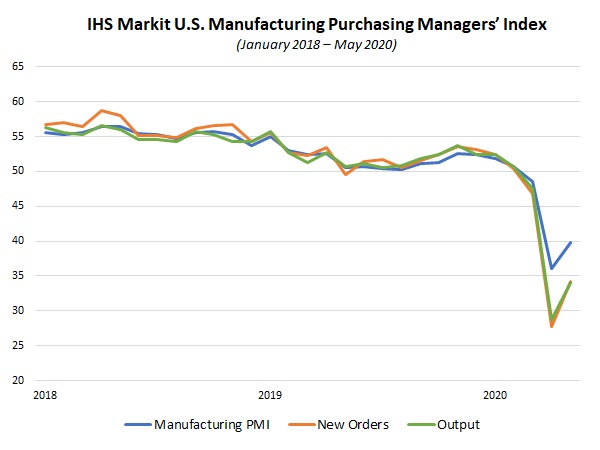
- After declining in April at the fastest rates since March 2009, the IHS Markit Flash U.S. Manufacturing PMI continued to contract sharply in May, albeit at a somewhat slower rate of decline. The headline index rose from 36.1 in April to 39.8 in May, with some easing in the contractions for new orders, production, exports and employment.
- In a similar way, the IHS Markit Flash Eurozone Manufacturing PMI rebounded in May after dropping in April at the quickest rate since February 2009.
- Mirroring the New York Federal Reserve release, manufacturing activity in the Philadelphia Fed’s survey continued to reflect deteriorating conditions due to the COVID-19 pandemic even as the headline index bounced back in April from its worst reading since July 1980. Encouragingly, respondents were cautiously optimistic about a strong rebound over the next six months.
- There were 2,438,000 initial unemployment claims for the week ending May 16, down from the 2,687,000 claims added for the week ending May 9. Since peaking at 6,867,000 for the week ending March 28, initial claims have decelerated, which is encouraging. However, these levels continue to be heartbreaking and unprecedented. Over the past seven weeks, 38,636,000 Americans filed for unemployment insurance.
- The housing market had historic declines in activity in April, but builders were somewhat less pessimistic in their outlook for the coming months. Low mortgage rates should help boost demand once stay-at-home orders are lifted and economic activity can start to resume, even in a more limited way.
- New residential construction fell 30.2% in April, extending the 18.6% slide seen in March. New housing starts have declined from an annualized 1,567,000 units in February to 1,276,000 units in March to 891,000 in April, the slowest pace since January 2014. New single-family and multifamily housing starts have fallen 37.1% and 54.8%, respectively, over the past two months.
- Housing permits declined 20.8% from 1,356,000 units at the annual rate in March to 1,074,000 units in April, the slowest rate since January 2015. While permitting has fallen 30.1% from January’s nearly 13-year high, there was also cause for some optimism, with permits not falling as much as starts. Since permits are a proxy of future activity, that perhaps gives reason for some cautious optimism that the housing market will improve over the coming months once the current crisis abates.
- Existing home sales fell 17.8% in April, extending the 8.5% decrease seen in March. Existing home sales have declined from an annualized 5.76 million units in February to 5.27 million units in March to 4.33 million units in April, the weakest reading since September 2011. In April, single-family and condominium and co-op sales fell 16.9% and 26.4%, respectively.
|
 |
|
| Economic Indicators |
|
Last Week's Indicators:
(Summaries Appear Below)
Monday, May 18
NAHB Housing Market Index
Tuesday, May 19
Housing Starts and Permits
Wednesday, May 20
None
Thursday, May 21
Conference Board Leading Indicators
Existing Home Sales
IHS Markit Flash U.S. Manufacturing PMI
Philadelphia Fed Manufacturing Survey
Weekly Initial Unemployment Claims
Friday, May 22
State Employment Report |
|
|
|
This Week's Indicators:
Monday, May 25
MEMORIAL DAY
Tuesday, May 26
Chicago Fed National Activity Index
Conference Board Consumer Confidence
Dallas Fed Manufacturing Survey
New Home Sales
Wednesday, May 27
Richmond Fed Manufacturing Survey
Thursday, May 28
Durable Goods Orders and Shipments
Gross Domestic Product (Revision)
Kansas City Fed Manufacturing Survey
Weekly Initial Unemployment Claims
Friday, May 29
International Trade in Goods (Preliminary)
Personal Consumption Expenditures Deflator
Personal Income and Spending |
|
|
| Deeper Dive |
|
- Conference Board Leading Indicators: After falling by 7.4% in March, which was the steepest decline in the survey’s 60-year history, the Leading Economic Index declined another 4.4% in April. With the U.S. economy slowing dramatically as consumers and businesses grapple with the COVID-19 pandemic, the headline index was pulled sharply lower by reductions in the average workweek of production workers, building permits, consumer confidence, new manufacturing orders and unemployment claims. In contrast, financial conditions, the interest rate spread and the stock market helped to offset some of that decrease, with each providing a positive contribution to the LEI in April.
Meanwhile, the Coincident Economic Index plummeted 8.9% in April, led by extraordinary declines in industrial production and nonfarm payrolls. Manufacturing and trade sales and personal income growth were slight positives in the latest CEI data, although not enough to prevent the record-setting decrease in April.
- Existing Home Sales: The National Association of Realtors reported that existing home sales fell 17.8% in April, extending the 8.5% decrease seen in March, as the residential market slowed materially due to the COVID-19 pandemic. Existing home sales have declined from an annualized 5.76 million units in February to 5.27 million units in March to 4.33 million units in April, the weakest reading since September 2011. In April, single-family and condominium and co-op sales fell 16.9% and 26.4%, respectively.
There were 4.1 months of supply on the market in April, up from 3.4 months in March, as the overall housing market slowed. The median sales price for existing homes has increased 7.4% year-over-year, up to $286,800 in April.
- Housing Starts and Permits: New residential construction fell 30.2% in April, extending the 18.6% slide seen in March, as the housing market slowed materially in light of the COVID-19 outbreak. Housing starts have declined from an annualized 1,567,000 units in February to 1,276,000 units in March to 891,000 in April, the slowest pace since January 2014. New single-family housing starts have decreased from 1,034,000 units in February to 871,000 units in March to 650,000 units in April. This 37.1% reduction over that two-month span represents a pace not seen since March 2015. Likewise, multifamily residential construction dropped from 533,000 units to 241,000 units between February and April, plummeting 54.8% in that time frame to the lowest level since June 2013.
Meanwhile, housing permits declined 20.8% from 1,356,000 units at the annual rate in March to 1,074,000 units in April, the slowest rate since January 2015. While permitting has fallen 30.1% from January’s nearly 13-year high, it is notable that the pace of permits exceeds starts at this point. Since permits are a proxy of future activity, that perhaps gives reason for some cautious optimism that the housing market will improve over the coming months once the current crisis abates. There was also some stabilization in expectations for single-family sales in the builder outlook, albeit with still more pessimism than optimism (see below).
In the April data, single-family permits have decreased from 994,000 units in February to 884,000 units in March to 669,000 units in April, a level not seen since March 2015. At the same time, multifamily activity declined from 472,000 units in March to 405,000 units in April, the lowest since March 2016.
- IHS Markit Flash U.S. Manufacturing PMI: After declining in April at the fastest rates since March 2009, manufacturing activity in the United States continued to contract sharply in May, albeit at a somewhat slower rate of decline. The headline index rose from 36.1 in April to 39.8 in May, with some easing in the contractions for new orders, production, exports and employment. The index for future output pulled back from 47.8 to 45.2, suggesting that manufacturing business leaders expect further reduction in production over the next six months. At the same time, the IHS Markit Flash U.S. Services Business Activity Index hit a record low in April, with consumer-facing businesses closed and Americans staying closer to home. It bounced back somewhat in the latest survey, up from 26.7 in April to 36.9 in May.
In a similar way, the IHS Markit Flash Eurozone Manufacturing PMI rebounded in May after dropping in April at the quickest rate since February 2009. The index rose from 33.4 in April to 39.5 in May, with progress across the board despite continuing weaknesses and ongoing sales and operational disruptions from the COVID-19 outbreak. Service-sector activity also jumped back from a jaw-dropping record low in the previous survey, up from 12.0 to 28.7. Slower contractions in activity were also observed in France, Germany and outside the European Union in the United Kingdom. Each had manufacturing contractions in April that were either at new all-time lows (France and the U.K.) or at rates not seen since the Great Recession (Germany).
- NAHB Housing Market Index: After confidence dropped in April to the lowest level since June 2012, the National Association of Home Builders and Wells Fargo said that confidence improved somewhat in May, albeit with continuing negative sentiment. The Housing Market Index rose from 30 in April to 37 in May. HMI data below 50 suggest that more builders are negative in their outlook than positive. NAHB Chief Economist Robert Dietz sounded a hopeful note, suggesting, “As many states and localities across the nation lift stay-at-home orders and more furloughed workers return to their jobs, we expect this demand will strengthen.” He also cited low mortgage rates, which should help boost housing construction activity.
The underlying data were mixed. There was some stabilization in the Housing Market Index for every region except for the Northeast, and the index for single-family home sales over the next six months improved from 36 to 46. While there was still more pessimism than optimism in that outlook, it was a step in the right direction. With that said, the index for current prospective buyer traffic remained very weak, inching up from 13 to 21.
- Philadelphia Fed Manufacturing Survey: Manufacturing activity in May continued to reflect deteriorating conditions due to the COVID-19 pandemic even as the headline index bounced back somewhat in April from its worst reading since July 1980. The composite index of general business activity rose from -56.6 in April to -43.1 in May, with declining activity across the board. More than half of respondents said that new orders were lower in May than in April, although one-quarter did say that sales were better.
With that said, the forward-looking index rose from 43.0 in April to 49.7 in May, the best reading since December 2017. This suggests that manufacturers in the Philly Fed’s district were cautiously optimistic about a strong rebound in activity over the next six months. For instance, 64.8% expect orders to rise over the coming months, with 10.1% predicting declines. Similarly, 34.5% and 29.1% see higher employment and capital spending, respectively, in their forecasts for the next six months.
Nonetheless, firms anticipate some disinflation in pricing pressures, forecasting just 1% growth in prices for their products and services over the next year, down from 2.5% in the February survey. Compensation costs should rise by 2.5% instead of the 3% expectation predicted just three months ago.
- Weekly Initial Unemployment Claims: There were 2,438,000 initial unemployment claims for the week ending May 16, down from the 2,687,000 claims added for the week ending May 9. Since peaking at 6,867,000 for the week ending March 28, initial claims have decelerated, which is encouraging. However, these levels continue to be heartbreaking and unprecedented. Over the past seven weeks, 38,636,000 Americans filed for unemployment insurance, illustrating dire conditions in the labor market as the COVID-19 crisis has taken hold. Nine states had at least 50,000 initial unemployment claims in the last week, with California, Florida, Georgia, New York, Texas and Washington exceeding 100,000.
Meanwhile, continuing claims increased from 22,548,000 for the week ending May 2 to 25,073,000 for the week of May 9 in this report, an all-time high. The latest figure suggests that 17.2% of the workforce received unemployment insurance that week, a rate that will continue to increase substantially given the initial claims data.
The unemployment rate could peak around 20% to 22% this month before starting to fall. The forecast is for the unemployment rate to be 10% by year’s end — a shocking turn of events in the labor market following February’s 50-year low, which registered 3.5%.
|
|
| Upcoming Webinar |
|
“Economic Impacts of COVID-19 and Getting Back to Work”
Thursday, May 28, 1 p.m.–2 p.m. ET
Click here to register.
Speakers
Chad Moutray, Chief Economist, NAM
Velislava Ivanova, Principal, Climate Change and Sustainability Services, EY
Luke Chandler, Chief Economist, Deere & Company
How does the current manufacturing economy compare to two months ago? What are the short- and long-term effects on manufacturing organizations and their employees? As the U.S. looks to reopen, manufacturers have a range of business considerations while ramping up the return to work. Join us for a discussion of the latest Manufacturing Outlook Survey results, as well as insights and findings from industry partners.
|
|
Thank you for subscribing to the NAM’s Monday Economic Report.
If you’re part of an NAM member company and not yet subscribed, email us. If you’re not an NAM member, become one today!
|
|
|
|
|
|
|
|
|
| Interested in becoming a presenter of the Monday Economic Report? Email us. |
|
| Questions or comments? Email NAM Chief Economist Chad Moutray at [email protected]. |
|
| You received this email because you signed up for the NAM’s Monday Economic Report as a part of your NAM membership. |
|
| Manage my email newsletters and alerts | Unsubscribe |
|
 |
|
| © 2020 National Association of Manufacturers |
|
|
|
|
|
|
|
