 |
| If you’re having trouble reading this, click here. |
|
s
| MONDAY ECONOMIC REPORT |
|
|
|
|
| Essential Takes on Leading Economic Indicators |
|
By Chad Moutray, Ph.D., CBE – June 8, 2020 – SHARE


|
|
<
|
|
|
| Unexpected Growth: Jobs Rebound in May, but Labor Market Remains Weak |
|
| The Weekly Toplines |
|
- The U.S. economy added 2,509,000 nonfarm payroll workers in May, a pleasant surprise relative to expectations for millions of fewer workers in the labor market. The data suggest that the jobs market stabilized sooner than anticipated, even as the labor market remains very weak, with the latest figures reflecting a sizable bounce back after the loss of 20,687,000 workers in April.
- The unemployment rate rose from 14.7% in April to 13.3% in May, with the number of unemployed workers falling from 23,078,000 in April to 20,985,000. With that said, the so-called “real unemployment rate”—which includes those marginally attached to the workforce, including discouraged workers and the underemployed—remained quite elevated despite dropping from 22.8% in April to 21.2% in May.
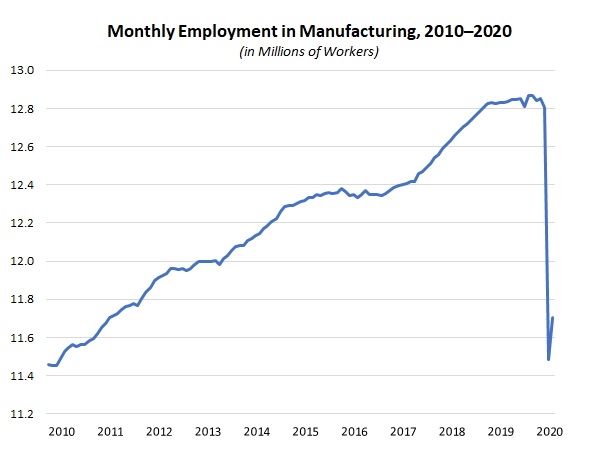
- In May, manufacturers added 225,000 workers, recovering some of the decline of 1,324,000 employees lost in April, with 14 of the 19 major sectors experiencing increases for the month. The current outlook is for manufacturing employment to bounce back to roughly 12,250,000 workers by year’s end, with an unemployment rate around 10%.
- It is interesting to juxtapose the latest jobs numbers with the weekly initial unemployment claims data. The latter have found that 42,647,000 Americans had filed for unemployment insurance in the past 11 weeks, with the weekly pace slowing since peaking during the week ending March 28.
- Meanwhile, after falling at the fastest pace in 11 years, the Institute for Supply Management® reported that the rate of decline in manufacturing activity slowed somewhat in May, rising from 41.5 in April to 43.1 in May. Even as this continues to reflect sharp contractions in activity across the board, the data also suggest that the worst of the downturn might be behind us.
- Some of the other economic indicators released last week show the extent of the recession’s negative impacts on manufacturing in April, before some of the rebounds seen in the May data.
- New orders for manufactured goods fell 13% in April, the largest monthly decline on record, extending the 11% decrease in March. Excluding transportation equipment, new factory orders fell 8.5% in April. On a year-over-year basis, new orders in the manufacturing sector have fallen by a sharp 22.3% since April 2019, or 13.2% year-over-year with transportation equipment excluded.
- The U.S. trade deficit rose to an eight-month high, but the data reflect significant reductions in trade volumes in light of COVID-19 and slowing global growth, with goods exports and imports falling to their weakest pace since at least 2010.
- In non-seasonally adjusted data, U.S.-manufactured goods exports fell 10.25% in the first four months of 2020 relative to the same time frame in 2019.
- Total private construction spending fell 3% in April, with private residential and nonresidential activity down 4.5% and 1.3%, respectively. Manufacturing was a bright spot—so to speak—eking out a 0.2% gain for the month.
|
 |
|
| Economic Indicators |
|
Last Week's Indicators:
(Summaries Appear Below)
Monday, June 1
Construction Spending
ISM® Manufacturing Purchasing Managers’ Index®
Tuesday, June 2
None
Wednesday, June 3
ADP National Employment Report
Factory Orders and Shipments
Thursday, June 4
International Trade Report
Productivity and Costs (Revision)
Weekly Initial Unemployment Claims
Friday, June 5
BLS National Employment Report |
|
|
|
This Week's Indicators:
Monday, June 8
None
Tuesday, June 9
Job Openings and Labor Turnover Survey
NFIB Small Business Survey
Wednesday, June 10
Consumer Price Index
FOMC Monetary Policy Statement
Thursday, June 11
Producer Price Index
Weekly Initial Unemployment Claims
Friday, June 12
University of Michigan Consumer Sentiment |
|
|
| Deeper Dive |
|
- ADP National Employment Report: Manufacturing employment fell by another 719,000 in May, extending the decline of 1,330,000 in April, according to ADP estimates. This suggests that 2,049,000 workers have been lost in the manufacturing sector in the past two months, with employment dropping to 10,730,000 in May. With that said, job growth should start to return in the coming months as stay-at-home orders are lifted and economic activity begins to accelerate once again, albeit likely at a slower pace than before.
Overall, there were 2,760,000 fewer workers at nonfarm private business establishments in May, with a jaw-dropping loss of 22,317,000 employees over the past two months. It is worth noting that May’s nonfarm payrolls employment number was well below the consensus estimate, which was for a decrease of around 8,000,000 workers.
Outside of manufacturing, other sectors with significant declines in May included trade, transportation and utilities (down 826,000), professional and business services (down 250,000), financial activities (down 196,000), education and health services (down 168,000), information (down 115,000) and leisure and hospitality (down 105,000).
In May, small and medium-sized businesses (i.e., those with fewer than 500 employees) shed 2,326,000 workers, or 84.3% of the total. This speaks to the unique challenges that smaller businesses face during the COVID-19 crisis.
- BLS National Employment Report: The U.S. economy added 2,509,000 nonfarm payroll workers in May, surprising to the upside relative to expectations for millions of fewer workers in the labor market. Instead, the data suggest that the jobs market stabilized sooner than anticipated, even as the labor market remains very weak, with the latest figures reflecting a sizable bounce back after the loss of 20,687,000 workers in April.
The unemployment rate rose from 14.7% in April to 13.3% in May, with the number of unemployed workers falling from 23,078,000 in April to 20,985,000. In addition, the so-called “real unemployment rate”—which includes those marginally attached to the workforce, including discouraged workers and the underemployed—declined from 22.8% in April to 21.2% in May. The participation rate in the labor force increased from 60.2% in April to 60.8% in May, with 1,746 more Americans in the labor force.
In May, manufacturers added 225,000 workers, recovering some of the decline of 1,324,000 employees lost in April. The largest increases in May in manufacturing employment included the following:
- Miscellaneous durable goods (up 31,000)
- Transportation equipment (up 26,000, including an increase of 27,700 for motor vehicles and parts)
- Plastics and rubber products (up 29,800)
- Food manufacturing (up 24,900)
- Fabricated metal products (up 24,800)
- Machinery (up 22,600)
- Furniture and related products (up 20,900)
- Nonmetallic mineral products (up 20,400)
At the same time, there were continuing job declines in the manufacturing sector for the following:
- Electrical equipment and appliances (down 15,300)
- Primary metals (down 9,400)
- Computer and electronic products (down 5,000)
- Petroleum and coal products (down 1,100)
- Paper and paper products (down 100)
The current outlook is for manufacturing employment to bounce back to roughly 12,250,000 workers by year’s end, with an unemployment rate around 10%.
- Construction Spending: Private manufacturing construction spending edged up 0.2%, increasing from $73.73 billion in March to $73.86 billion in April. Given the COVID-19 outbreak and the pullbacks in activity in other data, the slight increase in construction activity in the sector might be a bit surprising, but it is also important to note that activity has trended lower since November’s pace, which was $81.08 (and likely an outlier). On a year-over-year basis, private manufacturing construction has risen 1.6%.
Meanwhile, total private construction spending fell 3% in April, with private residential and nonresidential activity down 4.5% and 1.3%, respectively. Private single-family and multifamily construction both fell sharply, down 6.6% and 9.1%, respectively. The largest declines in private nonresidential construction in April occurred in the educational (down 9%), religious (down 7.7%), transportation (down 5.9%), commercial (down 2.3%) and amusement and recreation (down 1.8%) sectors. On a year-over-year basis, private residential and nonresidential construction has expanded 6.2% and 1.1%, respectively.
Public construction spending fell 2.5% in April, but with 0.8% growth over the past 12 months.
- Factory Orders and Shipments: New orders for manufactured goods fell 13% in April, the largest monthly decline on record, extending the 11% decrease in March, as firms continue to struggle with disruptions due to COVID-19. Significant declines in demand for motor vehicles and aircraft skewed the data. Excluding transportation equipment, new factory orders fell 8.5% in April, building on the 4% decline in March. Durable and nondurable goods orders plummeted by 17.7% and 9% in April, respectively, with durable goods sales excluding transportation down 7.7% for the month.
On a year-over-year basis, new orders in the manufacturing sector have fallen by a sharp 22.3% since April 2019, dropping to a level not seen since December 2009. With transportation equipment excluded, factory sales have fallen 13.2% year-over-year. Moreover, new orders for core capital goods (or nondefense capital goods excluding aircraft)—a proxy for capital spending in the U.S. economy—dropped 6.1% in April, with a decline of 6.8% over the past 12 months.
Meanwhile, factory shipments decreased 13.5% in April, with durable and nondurable goods shipments off 18.2% and 9%, respectively. With transportation equipment excluded, shipments declined 8.1% for the month. Since April 2019, manufactured goods shipments have decreased 18.9%, or a decline of 12.5% without transportation equipment included. Core capital goods shipments have fallen 7.4% year-over-year.
- International Trade Report: The U.S. trade deficit rose from $42.34 billion in March to $49.41 billion in April, an eight-month high. With economies around the world slowing due to COVID-19, sharp reductions occurred in trade volumes. Goods exports dropped from $127.72 billion to $95.52 billion, the lowest point since September 2009, more than offsetting the decrease in goods imports, which declined from $193.74 billion to $167.35 billion, the weakest pace since October 2010. Service-sector trade volumes also declined dramatically, both for exports and imports, with the service-sector trade surplus decreasing from $23.69 billion to $22.43 billion. On the positive side, the petroleum trade surplus was the highest on record, at $3.22 billion.
The underlying data reflect weaknesses in the economy and shifting trade patterns for airplanes, automobiles and parts, jewelry, machinery, metals and petroleum, pharmaceuticals and semiconductors and electronics, among other trends.
In April, the sizable decrease in goods exports stemmed from significant reductions in non-automotive capital goods (down $10.12 billion), industrial supplies and materials (down $9.13 billion), automotive vehicles, parts and engines (down $7.37 billion to the lowest level since March 1992) and consumer goods (down $4.40 billion). For goods imports, the declines stemmed mainly from sharp decreases for automotive vehicles, parts and engines (down $14.56 billion), non-automotive capital goods (down $5.75 billion) and consumer goods (down $3.10 billion).
In non-seasonally adjusted data, U.S.-manufactured goods exports totaled $334.71 billion though the first four months of 2020, dropping 10.25% from $372.92 billion for the same time frame in 2019.
- ISM® Manufacturing Purchasing Managers’ Index®: After falling at the fastest pace in 11 years in April, the Institute for Supply Management® reported that the rate of decline in manufacturing activity slowed somewhat in May, albeit still contracting sharply. The headline index rose from 41.5 in April to 43.1 in May, with firms continuing to grapple with major disruptions due to COVID-19 and sharply decreased energy prices. Production (up from 27.5 to 33.2) improved slightly from April’s record decline, and similar moves occurred for new orders (up from 27.1 to 31.8), exports (up from 35.3 to 39.5) and employment (up from 27.5 to 32.1). Even with some improvements, however, the data reflect a sector that continues to be severely challenged. Nearly 53% of survey respondents in May said that sales declined for the month, with 21.2% noting increased new orders and 26% reporting no change.
Given the weakened global economy, raw material prices (up from 35.3 to 40.8) continued to reflect deflationary pressures in the sector, but the index moved off of April’s pace, which registered the largest decline since January 2016. Commodities with higher prices in May included alcohol, crude oil, freight and personal protective equipment. Meanwhile, inventories (up from 49.7 to 50.4) expanded for the first time in one year. Timothy Fiore, chair of the ISM® Manufacturing Business Survey Committee, said that increased stockpiles likely came from “companies’ desire to have inventory on hand to respond to shorter lead time customer demand.”
- Productivity and Costs (Revision): Manufacturing labor productivity eked out a 0.3% gain at the annual rate in the first quarter, according to revised data. With the U.S. economy grappling with the economic impacts of COVID-19, output fell sharply at rates not seen since the second quarter of 2010, dropping 6.3%. The number of hours worked decreased 6.6%, with unit labor costs up 6.9%. Labor productivity for durable goods manufacturers declined 3.5% in the first quarter, with output off 10.2%. In contrast, labor productivity for nondurable goods firms rose 4.3% in the first quarter despite output and hours worked dropping 2% and 6.1%, respectively.
Meanwhile, nonfarm business labor productivity declined 0.9% in the first quarter, the steepest decrease since the fourth quarter of 2015. Output fell 6.5%, the largest decline in 11 years, with unit labor costs up 5.1%.
One of the larger economic concerns has been sluggishness of productivity growth since the Great Recession. Labor productivity in the manufacturing sector averaged -0.2% between 2011 and 2019, with nonfarm productivity averaging 0.9% over the same time period (but averaging 1.5% over the past three years).
- Weekly Initial Unemployment Claims: There were 1,877,000 initial unemployment claims for the week ending May 30, down from the 2,126,000 claims added for the week ending May 23. Since peaking at 6,867,000 for the week ending March 28, initial claims have decelerated, which is encouraging. However, these levels continue to be heartbreaking and unprecedented. Over the past 11 weeks, 42,647,000 Americans filed for unemployment insurance, illustrating dire conditions in the labor market as the COVID-19 crisis has taken hold. Six states had at least 50,000 initial unemployment claims in the past week: California, Florida, Georgia, New York, Pennsylvania and Texas.
Meanwhile, continuing claims rose from 20,838,000 for the week ending May 16 to 21,487,000 for the week ending May 23 in this report, with 14.8% of the workforce receiving unemployment insurance for the week.
|
|
Thank you for subscribing to the NAM’s Monday Economic Report.
If you’re part of an NAM member company and not yet subscribed, email us. If you’re not an NAM member, become one today!
|
|
|
|
|
|
|
|
|
| Interested in becoming a presenter of the Monday Economic Report? Email us. |
|
| Questions or comments? Email NAM Chief Economist Chad Moutray at [email protected]. |
|
| You received this email because you signed up for the NAM’s Monday Economic Report as a part of your NAM membership. |
|
| Manage my email newsletters and alerts | Unsubscribe |
|
 |
|
| © 2020 National Association of Manufacturers |
|
|
|
|
|
|
|
