 |
| If you’re having trouble reading this, click here. |
|
s
| MONDAY ECONOMIC REPORT |
|
|
|
|
| Essential Takes on Leading Economic Indicators |
|
By Chad Moutray, Ph.D., CBE – July 13, 2020 – SHARE


|
|
<
|
|
|
| Job Openings Improved in May but Remain Well Below Last Year's Pace |
|
| The Weekly Toplines |
|
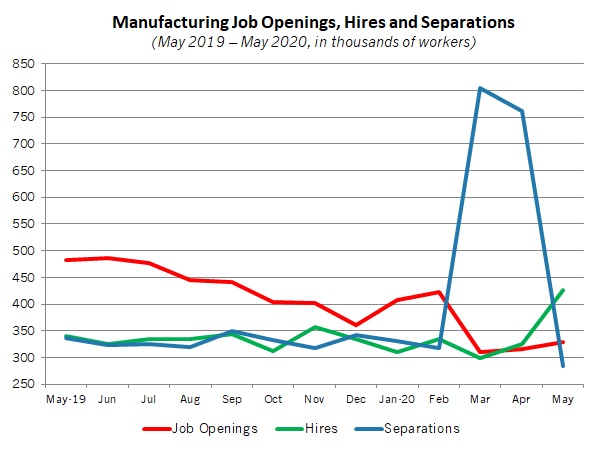
- There were 328,000 manufacturing job openings in May, up from 315,000 in April and improving for the second straight month after dropping to 310,000 postings in March, which was the slowest pace since October 2016. For comparison purposes, there were 482,000 postings one year ago. In the larger economy, nonfarm business job openings rose from 4,996,000 in April, the slowest pace since December 2014, to 5,397,000 in May, increasing after two months of declines.
- The COVID-19 outbreak has altered the manufacturing labor market dramatically. Manufacturers hired 426,000 workers in May, the most since April 2001. At the same time, total separations have declined from an all-time high of 804,000 in March, to 762,000 in April, to 284,000 in May, the lowest since November 2016. Net hiring was 142,000 in May, rebounding after net declines of 505,000 and 436,000 in March and April, respectively.
- There were 1,314,000 initial unemployment claims for the week ending July 4, continuing to decelerate after peaking at 6,867,000 for the week ending March 28 but remaining highly elevated. Meanwhile, 18,062,000 Americans received unemployment insurance for the week ending June 27, or 12.4% of the workforce.
- U.S. consumer credit outstanding fell 5.3% in May, with Americans pulling back sharply on spending during the COVID-19 pandemic for the third straight month. In May, revolving credit (which includes credit cards and other credit lines) plummeted 28.6%, reflecting the anxiousness of the consumer and the extent to which purchases—at least those done on credit—have fallen sharply.
- Over the past 12 months, consumer credit outstanding has risen just 0.9%. Nonrevolving credit (which includes auto and student loans) increased 3.8% year-over-year, but revolving credit dropped 7.2% year-over-year.
- Producer prices for final demand goods and services declined for the fourth time in the past five months, down 0.2% in June. At the same time, producer prices for final demand goods increased 0.2% in June, extending the 1.6% growth in May. Core inflation for raw material goods, which excludes food and energy, edged up 0.1% in June.
- There continue to be deflationary pressures in the economy, even with some stabilization, due to COVID-19 and the global recession. Over the past 12 months, producer prices for final demand goods and services have decreased 0.8%, the same pace as in May and remaining the lowest since December 2015. At the same time, core producer prices were flat year-over-year in June (seasonally adjusted), up from being down 0.4% in May.
- Real value-added output in the manufacturing sector declined an annualized 4.9% in the first quarter, pulling back for the second straight quarter from the all-time high in the third quarter of 2019. Manufacturing continued to account for 11% of real GDP in the first quarter.
|
 |
|
| Economic Indicators |
|
Last Week's Indicators:
(Summaries Appear Below)
Monday, July 6
Real GDP by Industry
Tuesday, July 7
Job Openings and Labor Turnover Survey
Wednesday, July 8
Consumer Credit
Thursday, July 9
Weekly Initial Unemployment Claims
Friday, July 10
Producer Price Index |
|
|
|
This Week's Indicators:
Monday, July 13
None
Tuesday, July 14
Consumer Price Index
NFIB Small Business Survey
Wednesday, July 15
Industrial Production
New York Fed Manufacturing Survey
Thursday, July 16
NAHB Housing Market Index
Philadelphia Fed Manufacturing Survey
Retail Sales
Weekly Initial Unemployment Claims
Friday, July 17
Housing Starts and Permits
State Employment Report
University of Michigan Consumer Sentiment |
|
|
| Deeper Dive |
|
- Consumer Credit: U.S. consumer credit outstanding fell 5.3% in May, with Americans pulling back sharply on spending during the COVID-19 pandemic for the third straight month. Total credit outstanding declined 4.5% and 20% in March and April, respectively. In May, revolving credit (which includes credit cards and other credit lines) plummeted 28.6%, reflecting the anxiousness of the consumer and the extent to which purchases—at least those done on credit—have fallen sharply. At the same time, nonrevolving credit (which includes auto and student loans) rose 2.3% in May, bouncing back somewhat after falling 4.6% in April.
Overall, total consumer credit registered $4.113 trillion in May, down from $4.131 trillion in April and a 10-month low. Revolving credit dropped from $1.020 trillion to $0.996 trillion for the month, a pace not seen since August 2017. Nonrevolving credit increased from $3.111 trillion to $3.117 trillion. Over the past 12 months, consumer credit outstanding has risen just 0.9%. Nonrevolving credit increased 3.8% year-over-year, but revolving credit dropped 7.2% year-over-year.
- Job Openings and Labor Turnover Survey: There were 328,000 manufacturing job openings in May, up from 315,000 in April and improving for the second straight month after dropping to 310,000 postings in March, which was the slowest pace since October 2016. For comparison purposes, there were 482,000 postings one year ago.
The COVID-19 outbreak has altered the manufacturing labor market dramatically. Manufacturers hired 426,000 workers in May, the most since April 2001 and increasing from 299,000 and 326,000 employees being hired in March and April, respectively. At the same time, total separations have declined from an all-time high of 804,000 in March, to 762,000 in April, to 284,000 in May, the lowest since November 2016. Net hiring was 142,000 in May, rebounding after net declines of 505,000 and 436,000 in March and April, respectively.
In the larger economy, nonfarm business job openings rose from 4,996,000 in April, the slowest pace since December 2014, to 5,397,000 in May, increasing after two months of declines. After experiencing more job openings than the number of people looking for work for 24 straight months, the abrupt stoppage of economic activity amid the COVID-19 outbreak sharply reversed that trend, starting in March. The number of unemployed Americans has fallen from 23,078,000 in April, to 20,985,000 in May, to 17,750,000 in June, according to the latest jobs data.
After dropping to levels not seen in at least seven years, the number of workers quitting their jobs increased in May, both for nonfarm businesses (up from 1,877,000, the lowest since October 2010, to 2,067,000) and manufacturing (up from 104,000, a pace not seen since March 2013, to 143,000). Meanwhile, layoffs declined again in May after being highly elevated in March and April. Nonfarm business layoffs have fallen from 11,489,000 in March, to 7,708,000 in April, to 1,796,000 in May. Similarly, layoffs in the manufacturing sector have dropped from 635,000 in April to 118,000 in May.
- Producer Price Index: Producer prices for final demand goods and services declined for the fourth time in the past five months, down 0.2% in June. At the same time, producer prices for final demand goods increased 0.2% in June, extending the 1.6% growth in May. Energy prices jumped for the second straight month, up 4.5% and 7.7% in May and June, respectively, but energy costs remain 17% lower than in June 2019. Meanwhile, food prices pulled back, down 5.2% in June after rising 6% in May. On a year-over-year basis, final demand food prices have increased 0.7% despite the volatility experienced in recent months. Core inflation for raw material goods, which excludes food and energy, edged up 0.1% in June, and producer prices for final demand services fell for the third consecutive month, down 0.3% in June.
Over the past 12 months, producer prices for final demand goods and services have decreased 0.8%, the same pace as in May and remaining the lowest since December 2015. At the same time, core producer prices were flat year-over-year in June (seasonally adjusted), up from being down 0.4% in May.
There continue to be deflationary pressures in the economy, even with some stabilization, due to COVID-19 and the global recession. For its part, the Federal Reserve has pursued extraordinary monetary policy measures to help prop up the economy—providing a financial “bridge” for consumers and businesses during the slowdown in activity, and it remains committed to its stimulative stance for the foreseeable future.
- Real GDP by Industry: The U.S. economy shrank 5% at the annual rate in the first quarter, as previously reported. According to new data from the Bureau of Economic Analysis, real value-added output in the manufacturing sector declined an annualized 4.9% from $2.185 trillion in the fourth quarter to $2.158 trillion in the first quarter, as expressed in chained 2012 dollars. As such, the sector pulled back for the second straight quarter from the all-time high for real value-added output in the third quarter of 2019, which was $2.190 trillion. Along those lines, real value-added output for durable goods edged down from $1.242 trillion in the fourth quarter, a record high, to $1.226 trillion in the first quarter.
Overall, manufacturing subtracted 0.53 percentage points from real GDP in the first quarter, dragging down the headline number for the second straight quarter. Manufacturing continued to account for 11% of real GDP in the first quarter.
Digging into the data, manufacturing value-added output decreased from $2.381 trillion in the fourth quarter, an all-time high, to $2.362 trillion in the first quarter. In the latest data, value-added output for durable goods also edged lower from its record pace, down from $1.348 trillion to $1.333 trillion, with nondurable goods activity also lower, down from $1.033 trillion to $1.028 trillion. The largest declines in value-added output in the first quarter occurred in aerospace and other transportation equipment; fabricated metal products; food, beverage and tobacco products; machinery; motor vehicles and parts; and petroleum and coal products, among others.
Similarly, manufacturing gross output has continued to ease since reaching the record high at the end of 2018 ($6.304 trillion). In the first quarter, gross output declined from $6.242 trillion to $6.131 trillion, the lowest level since the first quarter of 2018. Gross output for durable goods (down from $3.210 trillion to $3.134 trillion) and nondurable goods (down from $3.032 trillion to $2.998 trillion) also decreased in the first quarter.
- Weekly Initial Unemployment Claims: The week ending July 4 saw 1,314,000 initial unemployment claims, down from the 1,413,000 claims added for the week ending June 27. Initial claims have continued to decelerate since peaking at 6,867,000 for the week ending March 28, but they remain highly elevated.
Meanwhile, continuing claims declined from 18,760,000 for the week ending June 20 to 18,062,000 for the week ending June 27. In the latest data, 12.4% of the workforce received unemployment insurance, down from 12.9% in the previous report. |
|
Thank you for subscribing to the NAM’s Monday Economic Report.
If you’re part of an NAM member company and not yet subscribed, email us. If you’re not an NAM member, become one today!
|
|
|
|
|
|
|
|
|
| Interested in becoming a presenter of the Monday Economic Report? Email us. |
|
| Questions or comments? Email NAM Chief Economist Chad Moutray at [email protected]. |
|
| You received this email because you signed up for the NAM’s Monday Economic Report as a part of your NAM membership. |
|
| Manage my email newsletters and alerts | Unsubscribe |
|
 |
|
| © 2020 National Association of Manufacturers |
|
|
|
|
|
|
