 |
| If you’re having trouble reading this, click here. |
|
| MONDAY ECONOMIC REPORT |
|
|
|
|
| Essential Takes on Leading Economic Indicators |
|
By Chad Moutray, Ph.D., CBE – July 27, 2020– SHARE


|
|
<
|
|
|
| Signs of Economic Rebound Abound—For Now |
|
| The Weekly Toplines |
|
- The limited number of releases last week each highlighted the rebound in economic activity seen this summer following the sharp, unprecedented declines in the spring due to the COVID-19 pandemic. This is encouraging news, even as overall activity remains well below prerecessionary levels.
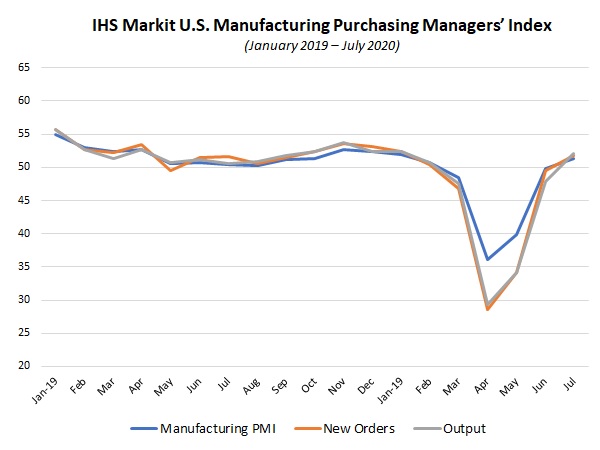
- The IHS Markit Flash U.S. Manufacturing PMI recovered in July to the best reading since January, bouncing back after pulling back sharply in April at the worst rate since the Great Recession. Manufacturers feel optimistic for continued production growth over the next six months.
- The IHS Markit Flash Eurozone Manufacturing PMI expanded in July at the fastest rate since December 2018, ending 17 straight months of contracting activity.
- Existing and new home sales soared 20.7% and 13.8% in June, respectively, and both have been boosted by historically low mortgage rates and reopenings across the country. It was the best reading for new single-family home sales since July 2007. With inventories low, median sales prices have pulled higher.
- The Chicago Federal Reserve Bank’s National Activity Index and the Conference Board’s Leading Economic Index reflect the bounce backs seen in the macroeconomy, with both rising in May and June after dropping at record declines in April.
- With that said, there have been some renewed closures related to the continued spread of COVID-19 in many areas, and this could lead to some softening in demand, production and hiring in forthcoming data. This was seen last week in the initial unemployment claims, with the first increase in 16 weeks.
- Meanwhile, continuing claims declined from 17,304,000 for the week ending July 4 to 16,197,000 for the week ending July 11. In the latest data, 11.1% of the workforce received unemployment insurance.
- There will be several key economic data points to watch this week.
- After weeks of speculation on just how bad it will be, the Bureau of Economic Analysis will release its first estimate of second quarter real GDP. My estimate is for a decline of 28%, but the consensus is for the U.S. economy to fall by more than 30%. Either would be unparalleled and a reflection of the scope of the damage from the COVID-19 outbreak.
- On the manufacturing front, there will be new surveys released from the Dallas and Richmond Federal Reserve Banks, along with a preliminary read on June durable goods orders and shipments. Each is expected to reflect stronger growth.
- The Federal Open Market Committee will meet this week, but it is not expected to make any significant changes from its statement on June 9–10 except to acknowledge recent economic progress.
- Other highlights include consumer confidence, international trade and personal income and spending.
|
 |
|
| Economic Indicators |
|
Last Week’s Indicators:
(Summaries Appear Below)
Monday, July 20
None
Tuesday, July 21
Chicago Fed National Activity Index
Wednesday, July 22
Existing Home Sales
Thursday, July 23
Conference Board Leading Indicators
Weekly Initial Unemployment Claims
Friday, July 24
IHS Markit Flash U.S. Manufacturing PMI
New Home Sales |
|
|
|
This Week's Indicators:
Monday, July 27
Dallas Fed Manufacturing Survey
Durable Goods Orders and Shipments
Tuesday, July 28
Conference Board Consumer Confidence
Richmond Fed Manufacturing Survey
Wednesday, July 29
Business Employment Dynamics
FOMC Monetary Policy Statement
International Trade in Goods (Preliminary)
Thursday, July 30
Gross Domestic Product (Second Quarter)
Weekly Initial Unemployment Claims
Friday, July 31
Employment Cost Index
Personal Consumption Expenditures Deflator
Personal Income and Spending
University of Michigan Consumer Sentiment (Revision) |
|
|
| Deeper Dive |
|
- Chicago Fed National Activity Index: The U.S. economy rebound strongly in May and June, according to the Chicago Federal Reserve Bank’s National Activity Index, following the record low in April. The headline index registered -18.09 in April but jumped to 3.50 in May and 4.11 in June. The three-month moving average for the NAI registered -7.52 in April, improving to -6.36 in May and -3.49 in June. It marked the 17th straight month with the three-month moving average below zero, suggesting growth below the historical trend. Readings at -0.70 or lower are consistent with the U.S. economy being in a recession. At the same time, the steadying of the current indicator in June provides some cautious optimism that the nation might be beyond the worst of the downturn.
Employment and production helped the NAI recover. In the latest month, manufacturing production rose 7.2% in June, extending the 3.8% rise in May. Even with some improvement, output in the sector has fallen 11.2% year-over-year. At the same time, manufacturers added 250,000 and 357,000 workers in May and June, respectively, reversing some of the decline of 1,317,000 employees lost in April, and the U.S. economy added 4,800,000 nonfarm payroll workers in June. In addition, the unemployment rate dropped to 11.1% for the month. Consumer spending and housing also contributed positively to the NAI in June, with both bouncing back in the latest data.
- Conference Board Leading Indicators: The Leading Economic Index rose 2% in June, building on the 3.2% increase in May as the U.S. economy continues to show signs of recovery after pulling back sharply in the spring due to the COVID-19 pandemic. Labor market variables helped to lift the LEI in June, with improvements in the average workweek for production workers and for initial weekly unemployment claims. Other positive contributors for the month included better building permits, the interest rate spread and stock prices. New manufacturing orders components were mixed, essentially providing a neutral contribution in June. Consumer confidence and lending conditions pulled the headline index somewhat lower.
Meanwhile, the Coincident Economic Index also rebounded, up 1.6% and 2.5% in May and June, respectively. All components were positive in June, including industrial production, manufacturing and trade sales, nonfarm payrolls and personal income less transfer payments. Manufacturing production rebounded for the second straight month, rising 7.2% in June, even as output has fallen 11.2% over the past 12 months.
- Existing Home Sales: Following steep declines in March, April and May, existing home sales soared 20.7% in June, according to the National Association of Realtors. Existing home sales plummeted from 5.76 million units at the annual rate in February, a 13-year high, to 3.91 million units in May, the slowest pace since October 2010. In June, activity rebounded to 4.72 million units. As such, existing home sales levels recovered much of the decrease, with gains in every region of the country, but remained well below the pre-recessionary pace. NAR Chief Economist Lawrence Yun noted that historically low mortgage rates have helped fuel demand, and he is optimistic for continued growth over the coming months.
In June, single-family and condominium and co-op sales jumped 19.9% and 29.4%, respectively. Yet, existing home sales have dropped 11.3% over the past 12 months, with single-family and condo/co-op sales down 9.9% and 22.8%, respectively. With the pickup in activity, inventories narrowed, down from 4.8 months of supply in May to 4.0 months in June. That remains higher than the 3.0 months of supply in February. The median sales price for existing homes has increased 3.5% year-over-year, up to $295,300 in June.
- IHS Markit Flash U.S. Manufacturing PMI: The manufacturing sector in the United States recovered in July to the best reading since January, bouncing back after pulling back sharply in April due to the COVID-19 pandemic at the worst rate since the Great Recession. The headline index increased from 49.8 in June to 51.3 in July on modest growth in new orders and output. Exports stabilized to a very slight expansion in July, and while hiring contracted for the fifth straight month, the pace of decline slowed to near neutral. More importantly, the index for future output jumped to 62.0 in July, the best reading since February and a sign that manufacturers in the United States feel optimistic for continued production growth over the next six months.
Similarly, the IHS Markit Flash Eurozone Manufacturing PMI expanded in July at the fastest rate since December 2018, with the sector rebounding after dropping in April by the most since February 2009. The index rose from 47.4 in June to 51.1 in July, ending 17 straight months of contracting activity and boosted by growth in new orders, exports and output. It was the strongest expansion in new orders since February 2018, with production growing at a pace not seen since August 2018. On the other hand, hiring continued to decline sharply, falling for the 13th consecutive month.
Meanwhile, French manufacturers expanded for the second straight month, slowing marginally in July but sustaining the bounce back in activity in June. The IHS Markit Flash Germany Manufacturing PMI improved from 45.2 in June to 50.0 in July, the first non-contracting month since December 2018, boosted by solid growth in demand and production. Outside the European Union, the United Kingdom grew at its strongest pace in 16 months, buoyed by strength in output, which expanded at the fastest rate since November 2017.
- New Home Sales: New single-family home sales soared 13.8% in June, building on the 19.4% gain in May and rising from 682,000 units to 776,000 units in the latest data, the best reading since July 2007. As such, the residential market has recovered after slowing dramatically due to the COVID-19 crisis and likely buoyed by historically low mortgage rates, with new home sales growth in every region of the country in June. Over the past 12 months, new single-family home sales have risen 6.9%, up from 726,000 units in June 2019.
Inventories of new homes for sale have narrowed, declining from 5.5 months in May to 4.7 months in June. That has helped boost prices. The median sales price was $329,200, up 5.6% from the $311,800 median one year ago.
- Weekly Initial Unemployment Claims: Initial unemployment claims rose from 1,307,000 for the week ending July 11 to 1,416,000 for the week ending July 18. This was the first increase in 16 weeks, reflecting some softening in the labor market due to some renewed closures related to the continued spread of COVID-19 in many areas. While the data remain highly elevated, initial claims have decelerated overall since peaking at 6,867,000 for the week ending March 28.
Meanwhile, continuing claims declined from 17,304,000 for the week ending July 4 to 16,197,000 for the week ending July 11. In the latest data, 11.1% of the workforce received unemployment insurance, down from 11.8% in the previous report. In addition, 13,179,880 Americans received Pandemic Unemployment Assistance for the week ending July 4, with 940,113 individuals obtaining Pandemic Emergency Unemployment Compensation. The Federal Pandemic Unemployment Compensation program provides an additional $600 per week to individuals who are collecting regular UC and is set to expire on July 31.
|
|
|
Thank you for subscribing to the NAM’s Monday Economic Report.
If you’re part of an NAM member company and not yet subscribed, email us. If you’re not an NAM member, become one today!
|
|
|
|
|
|
|
|
|
| Interested in becoming a presenter of the Monday Economic Report? Email us. |
|
| Questions or comments? Email NAM Chief Economist Chad Moutray at [email protected]. |
|
| You received this email because you signed up for the NAM’s Monday Economic Report as a part of your NAM membership. |
|
| Manage my email newsletters and alerts | Unsubscribe |
|
 |
|
| © 2020 National Association of Manufacturers |
|
|
|
|
|
|
|
