 |
| If you’re having trouble reading this, click here. |
|
| MONDAY ECONOMIC REPORT |
|
|
|
|
| Essential Takes on Leading Economic Indicators |
|
By Chad Moutray, Ph.D., CBE – August 17, 2020– SHARE


|
|
<
|
|
|
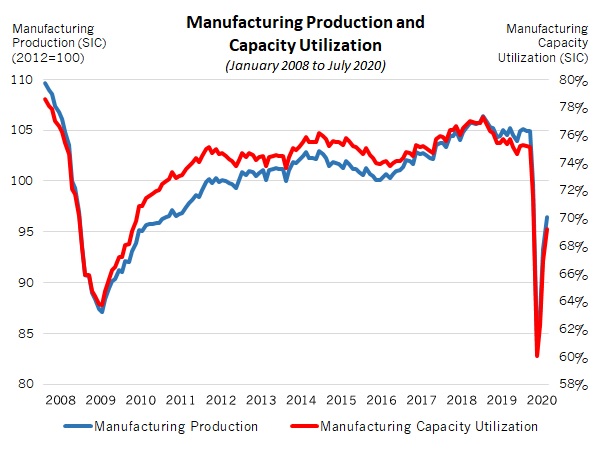
| Manufacturing Production Rebounded for the Third Straight Month |
|
| The Weekly Toplines |
|
- Manufacturing production rebounded for the third straight month, rising by 3.4% in July. Despite progress over the past few months, output in the sector has fallen 7.7% year-over-year, with durable and nondurable goods output down 9.3% and 5.4%, respectively. Manufacturing capacity utilization rose 69.2% in July, although that is still down from 75.2% in February.
- There were 336,000 manufacturing job openings in June, up from 306,000 in May, which had been the slowest pace since October 2016. Overall, job postings have drifted significantly lower over the past year—a trend that began before the COVID-19 pandemic. For instance, there were 486,000 and 360,000 job openings in the sector in June 2019 and December 2019, respectively.
- Consumer spending at retailers rose 1.2% in July, slowing from 18.3% and 8.4% gains seen in May and June, respectively. More importantly, it was the third straight monthly increase in consumer purchasing after stay-at-home orders sent sales plummeting in the spring. Excluding automobiles, retail sales rose 1.9% in July. Retail spending has risen by a modest 2.7% since July 2019.
- Moving forward, the August retail sales data will be closely watched, particularly with the expiration of the Federal Pandemic Unemployment Compensation program and the implementation of the president’s new, $400 per week in Lost Wages Assistance to certain unemployed or underemployed workers. Also, the continued spread of COVID-19 has led to renewed restrictions and closures in some areas of the country.
- Initial unemployment claims fell below one million claims for the first time since mid-March—a pace that remains highly elevated, illustrating continuing pain in the labor market. There were 15,486,000 Americans receiving unemployment insurance for the week ending Aug. 1, or 10.6% of the workforce.
- For its part, the Index of Consumer Sentiment from the University of Michigan and Thomson Reuters edged slightly higher in preliminary August data but remained well below prepandemic levels, suggesting that consumers remain more anxious about economic conditions than we would prefer.
- Manufacturing labor productivity fell 15.5% at the annual rate in the second quarter, the largest decline on record since the data series began in 1987. With the U.S. economy grappling with the economic impacts of COVID-19, output plummeted at unprecedented levels, down by a sharp annualized 47% for the quarter.
- Consumer and producer prices both jumped 0.6% in July, with costs bouncing back after experiencing declines in the spring due to COVID-19 and pullbacks in economic activity. Yet, pricing pressures remain in check for now, especially on a year-over-year basis.
- The Federal Reserve is more worried about propping up the economy right now, and it continues to pursue extraordinary measures to stimulate growth—a stance that is unlikely to change for the foreseeable future.
|
 |
|
| Economic Indicators |
|
Last Week’s Indicators:
(Summaries Appear Below)
Monday, August 10
Job Openings and Labor Turnover Survey
Tuesday, August 11
NFIB Small Business Survey
Producer Price Index
Wednesday, August 12
Consumer Price Index
Thursday, August 13
Weekly Initial Unemployment Claims
Friday, August 14
Industrial Production
Productivity and Costs
Retail Sales
University of Michigan Consumer Sentiment |
|
|
|
This Week's Indicators:
Monday, August 17
NAHB Housing Market Index
New York Fed Manufacturing Survey
Tuesday, August 18
Housing Starts and Permits
Wednesday, August 19
None
Thursday, August 20
Conference Board Leading Indicators
Philadelphia Fed Manufacturing Survey
Weekly Initial Unemployment Claims
Friday, August 21
Existing Home Sales
IHS Markit Flash U.S. Manufacturing PMI
State Employment Report |
|
|
| Deeper Dive |
|
- Consumer Price Index: Consumer prices jumped 0.6% in July, matching the increase in June and continuing to bounce back after declines in March, April and May. Energy prices rose 2.5% in July, with gasoline costs up 5.6% for the month. Yet, energy prices remain 11.2% lower than one year ago. At the same time, food prices decreased 0.4% in July, the first decline since April 2019, with food costs up 4.1% year-over-year.
Excluding food and energy, consumer prices also rose 0.6% in July, accelerating from a gain of 0.2% in June and the fastest monthly increase since January 1991. Apparel, household furnishings and supplies, medical services, new and used vehicles and transportation services all rose sharply in July, rebounding from declining costs in the spring.
Over the past 12 months, the consumer price index has risen 1.0%, up from 0.7% in June and 0.2% in May, which was the slowest year-over-year pace since October 2015. Meanwhile, core inflation (which excludes food and energy) has risen 1.6% since July 2019, up from 1.2% year-over-year in both May and June, which was the lowest since March 2011. Overall, consumer costs rose significantly in July, but inflationary pressures remain largely in check for now. Prices continue to reflect the economic effects of the COVID-19 pandemic and global recession.
- Industrial Production: Manufacturing production rebounded for the third straight month, rising by 3.4% in July. Durable and nondurable goods production increased 5.5% and 1.3% for the month, respectively. While the data showed steps in the right direction, manufacturers continue to grapple with the global COVID-19 pandemic, even as firms have resumed activity in the past three months. Output in the sector had fallen to the lowest level since June 1998 in April, and it will take awhile for manufacturing production to get back to prerecession levels. On a year-over-year basis, manufacturing production has declined 7.7%, with durable and nondurable goods output down 9.3% and 5.4%, respectively.
Manufacturing capacity utilization registered 60.0% in April, the lowest rate in the data’s history, which goes back to January 1948. However, sector rates now have gone up for three consecutive months. They rose to 69.2% in July, although that is still down from 75.2% in February.
In July, 17 of the 19 major manufacturing sectors saw increases in production, as the industry attempts to recover from steep declines since February. Sharp turnarounds in production occurred in many manufacturing sectors, with the most notable shift occurring in motor vehicles and parts, which saw output soar 28.3% in July. Other sectors with significant monthly increases in production in July included aerospace and miscellaneous transportation equipment (up 7.5%), miscellaneous durable goods (up 6.4%), petroleum and coal products (up 5%), textile and product mills (up 3.4%), printing and support (up 3.2%) and wood products (up 2.5%), among others. In contrast, production declined in July for paper (down 1.1%) and fabricated metal products (down 0.5%).
Even with gains in output in the latest release, all but one of the 19 major sectors in manufacturing still experienced declines in production on a year-over-year basis, with computer and electronic products being the only exception (up 2.4% since July 2019). The largest year-over-year declines occurred in the following sectors: primary metals (down 25.4%), aerospace and miscellaneous transportation equipment (down 20.5%), printing and support (down 16.3%), apparel and leather (down 14.9%), petroleum and coal products (down 14.2%) and electrical equipment and appliances (down 13.8%).
Meanwhile, total industrial production rose 3% in July, slowing from a gain of 5.7% in June. In addition to manufacturing, mining and utilities production also increased, up 0.8% and 3.3% for the month, respectively. Over the past 12 months, industrial production has dropped 8.2%. Total capacity utilization increased from a record low 64.2% in April to 70.6% in July. For comparison, it registered 76.9% in February.
- Job Openings and Labor Turnover Survey: There were 336,000 manufacturing job openings in June, up from 306,000 in May, which had been the slowest pace since October 2016. Overall, job postings have drifted significantly lower over the past year—a trend that began before the COVID-19 pandemic. For instance, there were 486,000 and 360,000 job openings in the sector in June 2019 and December 2019, respectively.
With that said, the COVID-19 outbreak has led to significant volatility in the manufacturing labor market over the past few months. Manufacturers hired 441,000 workers in June, down from an all-time high of 523,000 in May and up from 299,000 and 326,000 in March and April, respectively. At the same time, total separations increased from 285,000 in May, the lowest since November 2016, to 386,000 in June. Separations have trended lower, however, since peaking at a record high of 804,000 in March. There was net hiring of 238,000 and 55,000 in May and June, respectively, recovering some of the net declines of 505,000 and 436,000 in March and April.
In the larger economy, nonfarm business job openings rose from 4,996,000 in April, the slowest pace since December 2014, to 5,371,000 in May and 5,889,000 in June. To put that number in perspective, the number of unemployed Americans has fallen from 23,078,000 in April, to 20,985,000 in May, to 17,750,000 in June, to 16,338,000 in July, according to the latest jobs data.
After dropping to levels not seen in at least seven years in April, the number of workers quitting their jobs increased for the second straight month in June, both for nonfarm businesses (up from 2,067,000 to 2,598,000, a three-month high) and manufacturing (up from 143,000 to 197,000, the highest rate so far in 2020). Meanwhile, nonfarm business layoffs declined in both May and June after being highly elevated in March and April. Nonfarm business layoffs have fallen from 11,489,000 in March, to 7,708,000 in April, to 1,903,000 in May, to 1,885,00 in June. At the same time, layoffs in the manufacturing sector ticked higher, up from 121,000 in May to 170,000 in June, but down from 635,000 in April.
- NFIB Small Business Survey: The National Federation of Independent Business reported that the Small Business Optimism Index declined in July with lingering worries about the spread of COVID-19. The headline index fell from 100.6 in June to 98.8 in July, dropping below the all-important threshold of 100, which is traditionally consistent with small business growth. The percentage of respondents saying the next three months are a “good time to expand” dipped from 13% in June to 11% in July, which was higher than the 3% reading in April but well below the 26% who said the same thing in February.
While actually sales growth remains negative, a net 5% if small business owners expect sales to rise over the next three months, slowing from 13% in the June survey. Each of data points represent a vast improvement from April’s -42% reading, which was the lowest in the survey’s 46-year history.
Similarly, hiring remained negative for the fourth straight month, with a net of 11% decreasing their employment in July. Yet, the rate of owners planning to hire in the next three months rose from 16% to 18%, the strongest pace since February. In addition, 30% of respondents had job openings in July, down from 32% in June but up from 23% in May, which was the lowest since September 2014. Despite changed labor market dynamics, an insufficient workforce was once again the top “single most important problem,” cited by 21% of respondents. Other top concerns were taxes (18%) and government regulation (14%), likely reflecting some uncertainties related to the election.
There were some encouraging signs for capital spending. In July, 49% of small firms have made an investment over the past three months, up from 48% in the previous survey and off from the 57.1% average over the past 12 months. The percentage of respondents planning to make a capital investment over the next three to six months rose from 22% to 26%, matching the average pace experienced over the past year and the best reading since February.
- Producer Price Index: Producer prices for final demand goods and services rose 0.6% in July, the fastest monthly increase in input costs since October 2018. At the same time, producer prices for final demand goods jumped 0.8% in July, extending the 1.6% and 0.2% gains in May and June, respectively. Energy prices soared for the third straight month, up 5.3% in July, but energy costs remain 13.5% lower than in July 2019. Meanwhile, food prices decreased 0.5%, pulling back for the second consecutive month after rising 6.0% in May. On a year-over-year basis, final demand food prices were flat despite the volatility experienced in recent months. Core inflation for raw material goods, which excludes food and energy, rose 0.3% in July, the largest gain since January.
Over the past 12 months, producer prices for final demand goods and services have decreased 0.4%, up from -0.8% year-over-year in May and June, which were the lowest since December 2015. At the same time, core producer prices have inched up 0.1% since July 2019, up from being down 0.1% in June.
Therefore, even with sharp increases in raw material costs in July, overall costs remain in check for now, especially on a year-over-year basis. Given the deflationary pressures seen in the economy in the spring, it should not be a surprise that prices would bounce back strongly at some point. For its part, the Federal Reserve has pursued extraordinary monetary policy measures to help prop up the economy—providing a financial “bridge” for consumers and businesses during the slowdown in activity, and it remains committed to its stimulative stance for the foreseeable future.
- Productivity and Costs: Manufacturing labor productivity fell 15.5% at the annual rate in the second quarter, the largest decline on record since the data series began in 1987. With the U.S. economy grappling with the economic impacts of COVID-19, output plummeted at unprecedented levels, down by a sharp annualized 47% for the quarter. The number of hours worked decreased 37.3%, with unit labor costs soaring 31.1%. Labor productivity in the second quarter for durable and nondurable goods manufacturers dropped 28.4% and 4.9%, respectively. Output decreased at jaw-dropping rates, off 58.1% and 33.2%, respectively.
Meanwhile, nonfarm business labor productivity rose by an annualized 7.3% in the second quarter, the best reading in 11 years. With that said, output fell by a record-setting 38.9% for the quarter (dating back to 1947), with hours worked dropping by 43%. Unit labor costs increased 12.2% in the second quarter, the sharpest rise since the first quarter of 2014.
- Retail Sales: Consumer spending at retailers rose 1.2% in July, slowing from 18.3% and 8.4% gains seen in May and June, respectively. More importantly, it was the third straight monthly increase in consumer purchasing after stay-at-home orders sent sales plummeting in the spring. The data were weighed down by reduced sales at motor vehicles and parts dealers in July, which were off 1.2% for the month. Excluding automobiles, retail sales rose 1.9% in July. Retail spending has risen by a modest 2.7% since July 2019.
Moving forward, the August retail sales data will be closely watched, particularly with the expiration of the Federal Pandemic Unemployment Compensation program and the implementation of the president’s new, $400 per week in Lost Wages Assistance to certain unemployed or underemployed workers. Also, the continued spread of COVID-19 has led to renewed restrictions and closures in some areas of the country.
In July, electronics and appliance stores (up 22.9%), gasoline stations (up 6.2%), miscellaneous store retailers (up 6.2%), clothing and accessory stores (up 5.7%), food services and drinking places (up 5%) and health and personal care stores (up 3.6%) had the largest increases in retail spending. At the other end of the spectrum, declining sales affected sporting goods and hobby stores (down 5%), building material and garden supply stores (down 2.9%) and motor vehicles and parts dealers (down 1.2%). Excluding autos and gasoline stations, retail sales were up 0.9% in July.
The bright spots on a year-over-year basis included nonstore retailers (up 24.7%), sporting goods and hobby stores (up 17.8%), building material and garden supply stores (up 14.8%) and food and beverage stores (up 11.1%). In contrast, clothing and accessory stores (down 20.9%), food services and drinking places (down 18.9%), gasoline stations (down 15.6%) and department stores (down 13.4%) led the declines in retail sales over the past 12 months.
- University of Michigan Consumer Sentiment: Consumer confidence edged up from 72.5 in July to 72.8 in August, according to preliminary data from the University of Michigan and Thomson Reuters. Americans were slightly less upbeat about the current economic environment, but respondents were somewhat more optimistic in their outlook. Consumers were encouraged by lower interest rates, which helped buoy spending and housing activity. However, “policy gridlock” was a drag on confidence in the latest survey.
Overall, the headline index remains well below the levels seen before the COVID-19 outbreak. The Index of Consumer Sentiment reached a nearly two-year high in February at 101.0, before plummeting to 71.8 in April, its lowest level since December 2011. Sentiment is not far from April’s pace, even with marginal progress, which suggests that consumers remain more anxious about economic conditions than we would prefer.
- Weekly Initial Unemployment Claims: Initial unemployment claims declined from 1,191,000 for the week ending Aug. 1 to 963,000 for the week ending Aug. 8, falling below one million claims for the first time since the week ending March 14. Initial claims have decelerated overall since peaking at 6,867,00 for the week ending March 28. However, they remain highly elevated, illustrating continuing pain in the labor market.
Along those lines, continuing claims dropped from 16,090,000 for the week ending July 25 to 15,486,000 for the week ending Aug. 1. As such, 10.6% of the workforce was receiving unemployment insurance in the latest data, down from 11% in the previous report. |
|
| Take Action |
|
- If you have not already done so, please take a moment to complete the latest NAM Manufacturers’ Outlook Survey. This 22-question survey will help us gauge how manufacturing sentiment has changed since the second-quarter survey. The current survey includes special questions on third-quarter manufacturing activity, the prospects of returning to prepandemic levels of output and company experiences with COVID-19 legislative efforts. To complete the survey, click here. Responses are due by Friday, Aug. 28, at 5:00 p.m. EDT. As always, all responses are anonymous.
|
|
| Upcoming Webinar |
|
“State of the Industry: The Impact of COVID-19 on Manufacturing, August Update”
Tuesday, Aug. 25
1:00 p.m. – 2:00 p.m. EDT
Click here to register.
Panelists:
- Graham Immerman, Vice President of Marketing, MachineMetrics (moderator)
- Chad Moutray, Chief Economist, NAM
- Jerry Foster, Chief Technology Officer, Plex Systems, Inc.
- Lou Zhang, Chief Data Scientist, MachineMetrics
The COVID-19 pandemic has caused widespread concern and economic hardship for consumers, businesses and communities around the world. The situation is fast moving, with widespread impacts. One thing is for certain—it has and will continue to have global economic and financial ramifications that will be felt throughout the manufacturing industry. So, how has COVID-19 affected the near-term global manufacturing supply chain today? How will it be affected moving forward? How do we reshape and rebuild an industry that is both more sustainable and resilient for the future? This webinar will focus on how economic trends have changed since the previous one in June. |
|
|
Thank you for subscribing to the NAM’s Monday Economic Report.
If you’re part of an NAM member company and not yet subscribed, email us. If you’re not an NAM member, become one today!
|
|
|
|
|
|
|
|
|
| Interested in becoming a presenter of the Monday Economic Report? Email us. |
|
| Questions or comments? Email NAM Chief Economist Chad Moutray at [email protected]. |
|
| You received this email because you signed up for the NAM’s Monday Economic Report as a part of your NAM membership. |
|
| Manage my email newsletters and alerts | Unsubscribe |
|
 |
|
| © 2020 National Association of Manufacturers |
|
|
|
|
|
|
|
