 |
| If you’re having trouble reading this, click here. |
|
| MONDAY ECONOMIC REPORT |
|
|
|
|
| Essential Takes on Leading Economic Indicators |
|
By Chad Moutray, Ph.D., CBE – November 16, 2020 – SHARE


|
|
<
|
|
|
| Manufacturing Layoffs in September Fell to Lowest Level Since February 2017 |
|
| The Weekly Toplines |
|
- There were 456,000 manufacturing job openings in September, pulling back somewhat from the 469,000 postings in August, which was the best reading since July 2019. Overall, there were 1.95 unemployed workers for every one job opening in September, down from 4.6 in April but up from 0.8 in February.
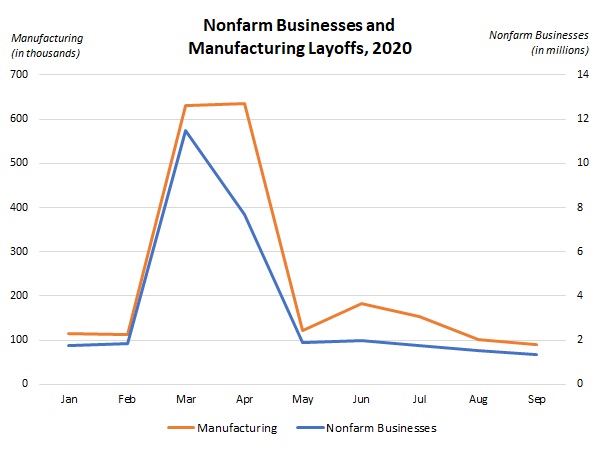
- Encouragingly, nonfarm business layoffs decreased from 1,533,000 in August to 1,333,000 in September, an all-time low. Meanwhile, layoffs in the manufacturing sector declined from 102,000 to 90,000, the lowest since February 2017 and well below the 635,000 layoffs in April.
- One sign of improved health is the “churn” seen in the labor market, and the number of quits has rebounded in recent months. This is also reassuring. Nonfarm payroll quits rose from 2,839,000 in August to 3,018,000 in September, the most since February, and manufacturing quits edged up from 207,000 to 212,000, a one-year high.
- The National Federation of Independent Business reported that the Small Business Optimism Index was flat at 104.0 in October, suggesting that small business owners remained upbeat overall. With that said, uncertainty was the highest since November 2016 as owners worry about lingering COVID-19 restrictions and operational challenges.
- NFIB survey respondents once again cited difficulties in obtaining enough labor as the top “single most important problem.” Other top concerns included taxes, regulations and poor sales.
- Consumer confidence dropped from 81.8 in October to 77.0 in preliminary November data, according to the University of Michigan and Thomson Reuters. Americans felt less upbeat in their outlook, with respondents reacting to the election and to rising COVID-19 cases.
- Producer prices for final demand goods increased 0.5% in October, the strongest monthly gain since July, boosted by sizable increases in energy and food costs. Yet, core inflation for raw material goods, which excludes food and energy, was flat in October. Overall, core producer prices have risen 0.9% year-over-year, the highest since March but remaining largely in check.
- Meanwhile, consumer prices were flat in October. Over the past 12 months, the consumer price index has risen 1.2%, and core consumer inflation has increased 1.6% since October 2019.
This week, there will be important updates on industrial production and retail sales that will be closely watched. Manufacturing production pulled back 0.3% in September, and manufacturers will be looking for a possible rebound in October. Overall, output in the sector remains down 6.4% from pre-pandemic levels in February. At the same time, economists will be looking for continuing growth in retail spending, especially heading into the holiday season. Retail sales increased a solid 1.9% in September.
|
 |
|
| Economic Indicators |
|
Last Week's Indicators:
(Summaries Appear Below)
Monday, November 9
None
Tuesday, November 10
Job Openings and Labor Turnover Survey
NFIB Small Business Survey
Wednesday, November 11
None
Thursday, November 12
Consumer Price Index
Weekly Initial Unemployment Claims
Friday, November 13
Producer Price Index
University of Michigan Consumer Sentiment |
|
|
|
This Week's Indicators:
Monday, November 16
New York Fed Manufacturing Survey
Tuesday, November 17
Industrial Production
NAHB Housing Market Index
Retail Sales
Wednesday, November 18
Housing Starts and Permits
Thursday, November 19
Conference Board Leading Indicators
Existing Home Sales
Kansas City Fed Manufacturing Survey
Philadelphia Fed Manufacturing Survey
Weekly Initial Unemployment Claims
Friday, November 20
State Employment Report |
|
|
| Deeper Dive |
|
- Consumer Price Index: Consumer prices were flat in October, slowing after a gain of 0.2% in September. Energy and food prices increased 0.1% and 0.2% in October, respectively, but with gasoline costs off 0.5%. Overall, energy prices remain 9.2% lower than one year ago, with gasoline prices down 18.0% year-over-year. At the same time, the cost of food has risen 3.9% over the past 12 months.
Excluding food and energy, consumer prices were also unchanged in October, following four months of increases. Prices for apparel, household furnishings, medical care and used cars and trucks were all lower in the latest data, with costs for new vehicles, shelter and transportation services increasing in October.
Over the past 12 months, the consumer price index has risen 1.2%, down from 1.4% in the previous release. Meanwhile, core inflation (which excludes food and energy) has risen 1.6% since October 2019, inching down from 1.7% year-over-year in September. While consumer costs have generally ticked higher since the spring, inflationary pressures remain largely in check for now and stabilized somewhat in October.
- Job Openings and Labor Turnover Survey: There were 456,000 manufacturing job openings in September, pulling back somewhat from the 469,000 postings in August, which was the best reading since July 2019 (477,000). Despite some easing in the latest data, the trendline is encouraging, with manufacturers once again increasing their interest in adding new workers and rebounding from springtime weaknesses due to COVID-19. In the larger economy, nonfarm business job openings increased from 6,352,000 in August to 6,436,000 in September.
Overall, 12,580,000 Americans were unemployed in September, down significantly from 23,078,000 in April but up sharply from 5,787,000 in February. That translates into 1.95 unemployed workers for every one job opening in September, down from 4.6 in April but up from 0.8 in February. (In October jobs data, the unemployment level dropped further to 11,061,000.)
In September, manufacturers hired 351,000 workers, down from 384,000 in August and with weaker data for both durable and nondurable goods firms. At the same time, total separations declined from 332,000 to 324,000. Net hiring (or hiring minus separations) was 27,000 in September, slowing from a gain of 52,000 in August but still a solid figure.
Encouragingly, nonfarm business layoffs decreased from 1,533,000 in August to 1,333,000 in September, an all-time low. Meanwhile, layoffs in the manufacturing sector declined from 102,000 to 90,000, the lowest since February 2017 and well below the 635,000 layoffs in April.
One sign of improved health is the “churn” seen in the labor market, and the number of quits has rebounded in recent months. This is also reassuring. Nonfarm payroll quits rose from 2,839,000 in August to 3,018,000 in September, the most since February, and manufacturing quits edged up from 207,000 to 212,000, a one-year high.
- NFIB Small Business Survey: The National Federation of Independent Business reported that the Small Business Optimism Index was flat at 104.0 in October. Overall, small business owners continued to feel upbeat in their assessments of the economy, particularly relative to what was seen in the spring. Readings above 100.0 are consistent with growth in the small business economy.
The percentage of respondents expecting sales to rise over the next three months increased from 8% to 11%, the best reading since June but well below what was seen pre-pandemic (in January, 23% of respondents predicted sales to increase). At the same time, the net percentage of respondents expecting business conditions to improve over the next six months declined from 32% to 27%, averaging 30% over the past seven months. Despite the easing in October, it continued to signal optimism about the coming months.
Meanwhile, while actual hiring was negative on net for the seventh straight month, employment has stabilized since the spring. Yet, labor market plans decelerated somewhat in the latest survey. The percentage of respondents planning to increase hiring over the next three months pulled back from 23% in September, the strongest pace since December 2018, to 18% in October. Nonetheless, respondents once again cited difficulties in obtaining enough labor as the top “single most important problem.”Regarding capital spending, 53% of small firms have made an investment over the past six months, the same pace as in September. In addition, the percentage of respondents planning to make a capital investment over the next three to six months inched down from 28% to 27%.
- Producer Price Index: Producer prices for final demand goods and services increased 0.3% in October, rising for the sixth straight month. In addition, producer prices for final demand goods increased 0.5% in October, the strongest monthly gain since July. Food prices jumped 2.4% in October, extending the 1.2% gain in September, and energy costs rose 0.8% in the latest data, bouncing back after two months of losses. Despite tremendous volatility this year due to the COVID-19 pandemic, the cost of food has risen a modest 2.0% over the past 12 months. In contrast, energy costs have fallen 12.3% year-over-year. Core inflation for raw material goods, which excludes food and energy, was flat in October following four months of increases.
Over the past 12 months, producer prices for final demand goods and services have increased 0.5% (seasonally adjusted), matching the pace in September. At the same time, core producer prices have risen 0.9% since October 2019, up from 0.7% growth year-over-year in the previous release and the highest since March.
The bottom line is that inflation remains largely in check for raw material costs, even as producer prices have risen in recent months. Given the deflationary pressures in the economy in the spring, it should not be a surprise that prices would bounce back strongly. Yet, core inflation has remained below 2% for 16 straight months. For its part, the Federal Reserve has pursued extraordinary monetary policy measures to help prop up the economy, and it remains committed to its stimulative stance for the foreseeable future.
- University of Michigan Consumer Sentiment: Consumer confidence dropped from 81.8 in October to 77.0 in preliminary November data, according to the University of Michigan and Thomson Reuters. Americans felt less upbeat in their outlook, with respondents reacting to the election and to rising COVID-19 cases. With that said, assessments about current economic conditions changed little, edging only marginally lower in November. Overall, consumer confidence remains well below the levels before the pandemic. The Index of Consumer Sentiment reached a nearly two-year high in February at 101.0, before plummeting to 71.8 in April, the lowest level since December 2011. Final data will be released Nov. 25.
- Weekly Initial Unemployment Claims: Initial unemployment claims totaled 709,000 for the week ending Nov. 7, down from 757,000 for the week ending Oct. 31. Initial claims have averaged 770,667 since the end of September, with significant progress since peaking at 6,867,000 for the week ending March 28. Yet, initial claims remain elevated, illustrating continuing pain in the labor market. For comparison purposes, initial claims peaked during the Great Recession at 665,000 for the week ending March 28, 2009.
Meanwhile, continuing claims declined from 7,222,000 for the week ending Oct. 24 to 6,786,000 for the week ending Oct. 31. This was consistent with 4.6% of the workforce, down from 4.9% in the previous report. Nonetheless, 21,157,111 Americans received some form of unemployment insurance benefit (including state and federal programs) for the week ending Oct. 24, down from 22,531,290 for the week ending Oct. 17. |
|
Thank you for subscribing to the NAM’s Monday Economic Report.
If you’re part of an NAM member company and not yet subscribed, email us. If you’re not an NAM member, become one today!
|
|
|
|
|
|
|
|
|
| Interested in becoming a presenter of the Monday Economic Report? Email us. |
|
| Questions or comments? Email NAM Chief Economist Chad Moutray at [email protected]. |
|
| You received this email because you signed up for the NAM’s Monday Economic Report as a part of your NAM membership. |
|
| Manage my email newsletters and alerts | Unsubscribe |
|
 |
|
| © 2020 National Association of Manufacturers |
|
|
|
|
|
|
|
