 |
| If you’re having trouble reading this, click here. |
|
| MONDAY ECONOMIC REPORT |
|
|
|
|
| Essential Takes on Leading Economic Indicators |
|
By Chad Moutray, Ph.D., CBE – November 23, 2020 – SHARE


|
|
<
|
|
|
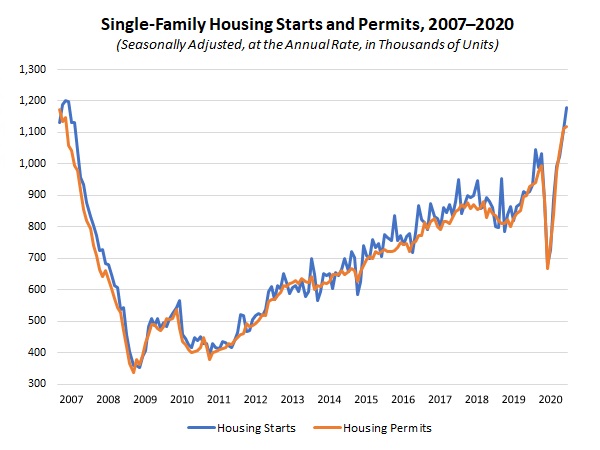
| Single-Family Housing Starts Soared to Best Reading Since April 2007 |
|
| The Weekly Toplines |
|
- New residential construction rose 4.9% to 1,530,000 units at the annual rate in October, the strongest pace since February. The data were buoyed by continued strength in the single-family segment, which increased to 1,179,000 units, the best reading since April 2007. Americans have responded to historically low mortgage rates, which hit another record low last week. Other data also reflected strength and optimism in the housing market, including the following:
- Housing permits were flat at 1,545,000 units in October, remaining the strongest pace since March 2007 and pointing to solid growth over the coming months.
- For their part, builders also feel more upbeat in their expectations for single-family sales over the next six months, with sentiment reaching another all-time high in November.
- Existing home sales jumped to the highest level since February 2006, up 4.3% to 6.85 million in October. Inventories narrowed to just 2.5 months of supply on the market, a record low.
- Manufacturing production increased 1.0% in October, strengthening after edging up just 0.1% in September and rising for the sixth straight month. Overall, manufacturing production remained 4.8% below the pre-pandemic pace in February, with output in the sector continuing to rebound following the 20.1% decline between February and April due to the COVID-19 pandemic. Here are some other developments of the relative health of the manufacturing sector:
- Manufacturing capacity utilization rose from 71.0% in September to 71.7% in October. This represents tremendous progress from the spring, but down from 75.2% in February.
- Total industrial production also rebounded in October, up 1.1% for the month, boosted by strength in manufacturing and utilities, but down 5.3% year-over-year.
- Surveys from the Kansas City, New York and Philadelphia Federal Reserve Banks each found continuing expansions in November in their districts, albeit with some slowing. Respondents remained upbeat in their outlook. In the Kansas City release, more than 50% had issues finding talent.
- Ohio created the most net new manufacturing jobs in October, adding 8,100 workers. The national unemployment rate fell to 6.9% in October, with Nebraska having the lowest in the nation, at 3.0%. Hawaii had the highest at 14.3%.
- Consumer spending at retailers slowed in October, increasing 0.3% following the 1.6% gain in September. More encouragingly, retail sales have now risen for six straight months following historic declines in the spring due to COVID-19-related retail closures. Over the past 12 months, retail sales have risen 5.7%.
P.S.: Due to the Thanksgiving holiday, the Monday Economic Report will not be published on Monday, Nov. 30. The next issue will be released on Monday, Dec. 7.
|
 |
|
| Economic Indicators |
|
Last Week's Indicators:
(Summaries Appear Below)
Monday, November 16
New York Fed Manufacturing Survey
Tuesday, November 17
Industrial Production
NAHB Housing Market Index
Retail Sales
Wednesday, November 18
Housing Starts and Permits
Thursday, November 19
Conference Board Leading Indicators
Existing Home Sales
Kansas City Fed Manufacturing Survey
Philadelphia Fed Manufacturing Survey
Weekly Initial Unemployment Claims
Friday, November 20
State Employment Report
|
|
|
|
This Week's Indicators:
Monday, November 23
Chicago Fed National Activity Index
IHS Markit Flash U.S. Manufacturing PMI
Tuesday, November 24
Conference Board Consumer Confidence
Richmond Fed Manufacturing Survey
Wednesday, November 25
Durable Goods Orders and Shipments
Gross Domestic Product (Revision)
International Trade in Goods (Preliminary)
New Home Sales
Personal Consumption Expenditures Deflator
Personal Income and Spending
University of Michigan Consumer Sentiment (Revision)
Weekly Initial Unemployment Claims
Thursday, November 26
THANKSGIVING HOLIDAY
Friday, November 27
None |
|
|
| Deeper Dive |
|
- Conference Board Leading Indicators: The Leading Economic Index rose 0.7% for the second straight month in October, increasing for the sixth consecutive month but still 2.9% lower than pre-pandemic levels in February. New manufacturing orders contributed positively to the LEI for the fifth straight month. Other bright spots in October included the average workweek of production workers, initial unemployment claims, the interest rate spread, lending conditions and the stock market. The contributions to the LEI from building permits and consumer confidence were neutral for the month.
Meanwhile, the Coincident Economic Index also increased for the sixth consecutive month, rising 0.5% in October but down 4.6% since February. All four CEI components—industrial production, manufacturing and trade sales, nonfarm payrolls and personal income less transfer payments—contributed positively in October. For its part, manufacturing production rose 1.0% in October. However, output in the sector remained 4.8% below pre-pandemic levels (see below).
- Existing Home Sales: The National Association of Realtors reported that existing home sales jumped to the highest level since February 2006, up 4.3% from 6.57 million units in September to 6.85 million in October. More importantly, the housing market continues to be a bright spot, having more than completely recovered after dropping to 3.91 million units in May, the slowest pace since October 2010. Every region of the country saw increases in existing home sales, with historically low mortgage rates helping to buoy increased sales.
In October, single-family and condominium and co-op sales increased 4.1% and 5.8%, respectively. Over the past 12 months, existing home sales have risen 26.6%, up from 5.41 million units in October 2019. Single-family sales jumped 26.7% year-over-year, with condo/co-op sales up 25.9% from the pace one year ago.
With the pickup in activity, inventories narrowed from 2.7 months of supply in September to just 2.5 months in October, a record low. The median sales price for existing homes has increased 15.5% year-over-year, up to $313,000 in October.
- Housing Starts and Permits: New residential construction rose 4.9% from 1,459,000 units at the annual rate in September to 1,530,000 units in October, the strongest pace since February. The data were buoyed by continued strength in the single-family segment, which increased from 1,108,000 units to 1,179,000 units, the best reading since April 2007. At the same time, multifamily residential construction starts were unchanged at 351,000 units in October.
The housing market has been boosted by historically low mortgage rates, with the sector bouncing back from steep COVID-19-related declines in the spring. On a year-over-year basis, housing starts have risen 14.2% from 1,340,000 units in October 2019, with single-family activity jumping 29.4% over the past 12 months.
Meanwhile, housing permits were flat at 1,545,000 units in October, remaining the strongest pace since March 2007 and pointing to solid growth in the housing market over the coming months. For their part, builders also feel more upbeat in their expectations for single-family sales over the next six months, with sentiment reaching another all-time high in November (see below).
Single-family permits increased from 1,113,000 units in September to 1,120,000 in October, the highest reading since March 2007. In contrast, multifamily permitting eased from 432,000 units to 425,000 units. Over the past 12 months, housing permits have risen 2.8% from 1,503,000 units in October 2019, but with single-family permits soaring 20.6% year-over-year.
- Industrial Production: Manufacturing production increased 1.0% in October, strengthening after edging up just 0.1% in September and rising for the sixth straight month. Durable and nondurable goods production rose 0.9% and 1.2% for the month, respectively. Overall, manufacturing production remained 4.8% below the pre-pandemic pace in February, with output in the sector continuing to rebound following the 20.1% decline between February and April due to the COVID-19 pandemic. Expressed on a year-over-year basis, manufacturing production has declined 3.9% since October 2019, with durable and nondurable goods output down 4.2% and 3.0%, respectively.
Manufacturing capacity utilization increased from 71.0% in September to 71.7% in October. This represents tremendous progress from the 60.1% rate in April, the lowest in the data’s history, which dates to January 1948. For comparison purposes relative to before the pandemic, it registered 75.2% in February.
In October, the largest increases in manufacturing production occurred in printing and related support activities (up 3.6%), miscellaneous durable goods (up 3.6%), nonmetallic mineral products (up 3.0%), aerospace and miscellaneous transportation equipment (up 2.3%), paper (up 2.2%) and primary metals (up 2.0%), among others. In contrast, output declined for furniture and related products (down 1.2%), textiles and products (down 1.0%), fabricated metal products (down 0.2%) and motor vehicles and parts (down 0.1%).
Even with gains in output in recent months, all but two of the major manufacturing sectors have experienced reduced production on a year-over-year basis, with motor vehicles and parts (up 6.9%) and computer and electronic products (up 1.3%) being the exceptions. The biggest year-over-year declines occurred in petroleum and coal products (down 14.8%), aerospace and miscellaneous transportation equipment (down 12.5%), furniture and related products (down 11.1%), apparel and leather goods (down 10.0%), primary metals (down 10.0%) and printing and related support activities (down 9.9%).
Meanwhile, total industrial production rebounded, rising 1.1% in October after declining 0.4% in September. Utilities production jumped 3.9% for the month on colder temperatures, but mining output fell 0.6%. Over the past 12 months, industrial production has dropped 5.3%. Total capacity utilization increased from a record low 64.2% in April to 72.8% in October, which is encouraging. Yet, total capacity utilization registered 76.9% in February before the pandemic.
- Kansas City Fed Manufacturing Survey: Manufacturing activity expanded for the sixth straight month, but the composite index of general business conditions slipped from 13 in October to 11 in November. Growth for new orders, shipments, production and employment slowed in November, but the average employee workweek rose marginally. Exports contracted once again, falling for the eighth time year to date. At the same time, prices for raw materials pulled back from the fastest pace since November 2018 but continued to rise solidly.
The report also states, “Over half of firms reported an inability to find skilled workers, and the lack of qualified applicants is one of the biggest factors restraining hiring plans.” This is consistent with the findings of the NAM Manufacturers’ Outlook Survey, which found that 55% of member companies struggled to find sufficient talent in the most recent release.
Moving forward, respondents continued to feel cautiously positive about additional growth over the next six months, with strong expansions expected for new orders, production and hiring and modest gains for capital spending and exports.
- NAHB Housing Market Index: The National Association of Home Builders and Wells Fargo reported that confidence reached another record high in November. The Housing Market Index rose from 85 in October to 90 in November. HMI data exceeding 50 suggest that more builders feel positive in their outlook than negative. The latest data suggest that builders feel extremely upbeat in their assessments of the housing market, buoyed by historically low mortgage rates. NAHB Chief Economist Robert Dietz cited rising construction costs, especially for lumber, and shortages of available lots. He also noted increased interest in locating in the suburbs and exurbs as Americans look to avoid highly dense areas.
The HMI improved in every region of the country except the Northeast, and the index for current single-family home sales rose from 90 to 96, an all-time high. At the same time, the index for expected single-family sales also increased to a new record, inching up from 88 to 89. That suggests builders feel very optimistic about increased sales moving forward.
- New York Fed Manufacturing Survey : Manufacturing activity expanded in the New York Federal Reserve Bank’s district for the fifth consecutive month in November, albeit at the slowest pace since August. The composite index of general business activity declined from 10.5 in October to 6.3 in November, with new orders, shipments and the average employee workweek slowing for the month. Inventories deteriorated further, with reduced stockpiles for the eighth straight month. Encouragingly, employment grew at the best rate since January, increasing modestly in November. Similarly, the prices paid index also picked up, with input costs rising at the fastest rate since January.
Meanwhile, manufacturers in the Empire State Manufacturing Survey remain upbeat about stronger activity over the next six months, with the forward-looking composite index edging up from 32.8 in October to 33.9 in November. Roughly half of respondents expect new orders to rise moving forward, with 33.7% and 30.5% anticipating more employment and capital spending, respectively.
- Philadelphia Fed Manufacturing Survey: Manufacturing activity slowed somewhat in November but continued to expand solidly overall, continuing to show signs of recovery since the spring. The composite index declined from 32.3 in October, an eight-month high, to 26.3 in November, with some easing for new orders and shipments in the latest data. On the other hand, the labor market variables were encouraging. The indices for employment (up from 12.7 to 27.2) and the average employee workweek (up from 25.3 to 25.7) accelerated to the best readings since at least June 2018. Likewise, the prices paid for input costs grew at the fastest rate in two years, even as 59.1% of respondents cited no change in raw material prices in November.
At the same time, manufacturers in the district remained very positive in their outlook despite slipping somewhat in the latest survey. The forward-looking composite index dropped from 62.7 to 44.3, with the outlook still solid overall. More than 60% of business leaders in the region expect new orders to increase over the next six months, with at least 40% predicting more hiring and capital spending. Respondents anticipate final goods prices will rise 2.0% over the next year, with firms’ compensation costs (including wages and benefits) up 3.0%. Manufacturing leaders expect consumer prices for goods and services to increase 2.5% on average over the next 10 years.
- Retail Sales: Consumer spending at retailers slowed in October, increasing 0.3% following the 1.6% gain in September. More encouragingly, retail sales have now risen for six straight months following historic declines in the spring due to COVID-19-related retail closures. Government transfer payments likely boosted the data in May and June, and retail activity has exceeded pre-pandemic levels for the fifth consecutive month. This contrasts with many other economic measures, including production and employment. Over the past 12 months, retail sales have risen 5.7%, or with motor vehicles and parts and gasoline excluded, spending has increased a robust 6.5% since October 2019.
In October, consumers spent more at nonstore retailers (up 3.1%), electronics and appliance stores (up 1.2%), building material and garden supply stores (up 0.9%), gasoline stations (up 0.4%) and motor vehicle and parts dealers (up 0.4%). At the same time, notable declines occurred in retail sales for department stores (down 4.6%), clothing and accessory stores (down 4.2%), sporting goods and hobby stores (down 4.2%), miscellaneous store retailers (down 0.9%) and furniture and home furnishings stores (down 0.4), among others.
The bright spots on a year-over-year basis included nonstore retailers (up 29.1%), building material and garden supply stores (up 19.5%), sporting goods and hobby stores (up 12.4%), motor vehicles and parts dealers (up 10.7%) and food and beverage stores (up 10.3%). In contrast, food services and drinking places (down 14.2%), gasoline stations (down 14.0%), clothing and accessory stores (down 12.6%), department stores (down 11.9%) and electronics and appliance stores (down 3.9%) each experienced retail sales declines over the past 12 months.
- State Employment Report: Ohio created the most net new manufacturing jobs in October, adding 8,100 workers. Other states with notable employment growth for the month included Texas (up 7,900), California (up 4,500), Florida (up 4,400), Georgia (up 3,300) and Tennessee (up 3,200). Despite gains over the past six months, manufacturing employment figures continue to experience sizable declines due to COVID-19. Since February, the states with the largest job decreases in the sector included California (down 89,100), Michigan (down 59,000), New York (down 43,100), Pennsylvania (down 39,100), North Carolina (down 36,800) and Indiana (down 34,700).
The national unemployment rate dropped sharply from 7.9% in September to 6.9% in October, and the unemployment rate fell in 37 states in the latest data. Hawaii had the highest unemployment in the country at 14.3%, followed by Nevada (12.0%), New York (9.6%), Louisiana (9.4%) and California (9.3%). At the other end of the spectrum, the lowest unemployment rates in the United States in October occurred in Nebraska (3.0%), Vermont (3.2%), South Dakota (3.6%), Iowa (3.6%), Utah (4.1%), South Carolina (4.2%) and New Hampshire (4.2%).
- Weekly Initial Unemployment Claims: Initial unemployment claims totaled 742,000 for the week ending Nov. 14, up from 711,000 for the week ending Nov. 7 and ending four consecutive weekly declines. Initial claims have averaged 767,714 per week since the end of September but remain highly elevated despite significant progress since peaking at 6,867,000 for the week ending March 28.
Meanwhile, continuing claims declined from 6,801,000 for the week ending Oct. 31 to 6,372,000 for the week ending Nov. 7. This was consistent with 4.3% of the workforce, down from 4.6% in the previous report. At the same time, 20,319,615 Americans received some form of unemployment insurance benefit (including state and federal programs) for the week ending Oct. 31, down from 21,160,860 for the week ending Oct. 24.
|
|
| Take Action |
|
- If you have not already done so, please take a moment to complete the latest NAM Manufacturers’ Outlook Survey. This survey will help gauge how manufacturing sentiment has changed since the third-quarter survey. To complete the survey, click here. Responses are due by Thursday, Dec. 3, at 5:00 p.m. EST. As always, all responses are anonymous.
- Please join me on Tuesday, Dec. 8, from 11:00 a.m. to 1:00 p.m. EST for a special webinar, titled “The Digitization of the Supply Chain: The Economy, the Pandemic and Manufacturing.” This webinar will discuss the myriad learnings for the manufacturing sector that have emerged as a result of the pandemic, highlighting opportunities to improve and strengthen the supply chain to mitigate future disruptions. In addition, there will be a discussion on the current economic and policy environment, including an economic outlook presentation from me. To register, click here.
|
|
Thank you for subscribing to the NAM’s Monday Economic Report.
If you’re part of an NAM member company and not yet subscribed, email us. If you’re not an NAM member, become one today!
|
|
|
|
|
|
|
|
|
| Interested in becoming a presenter of the Monday Economic Report? Email us. |
|
| Questions or comments? Email NAM Chief Economist Chad Moutray at [email protected]. |
|
| You received this email because you signed up for the NAM’s Monday Economic Report as a part of your NAM membership. |
|
| Manage my email newsletters and alerts | Unsubscribe |
|
 |
|
| © 2020 National Association of Manufacturers |
|
|
|
|
|
|
|
