 |
| If you’re having trouble reading this, click here. |
|
| MONDAY ECONOMIC REPORT |
|
|
|
|
| Essential Takes on Leading Economic Indicators |
|
By Chad Moutray, Ph.D., CBE – December 7, 2020 – SHARE


|
|
<
|
|
|
| Despite Slowing in Many Markets, Manufacturing Remains Encouraging |
|
| The Weekly Toplines |
|
- Manufacturing continued to expand in the latest data, even while signs of slowing persist in many markets and with activity remaining below pre-pandemic levels.
- The Institute for Supply Management® said that manufacturing activity in November pulled back from October, which had recorded the fastest pace since September 2018. The index noted decelerating—but still solid—expansions for new orders and production.
- Demand and output in the sector expanded for the sixth straight month, bouncing back from steep declines from COVID-19 in the spring. Yet, supply chain disruptions continued to challenge many firms.
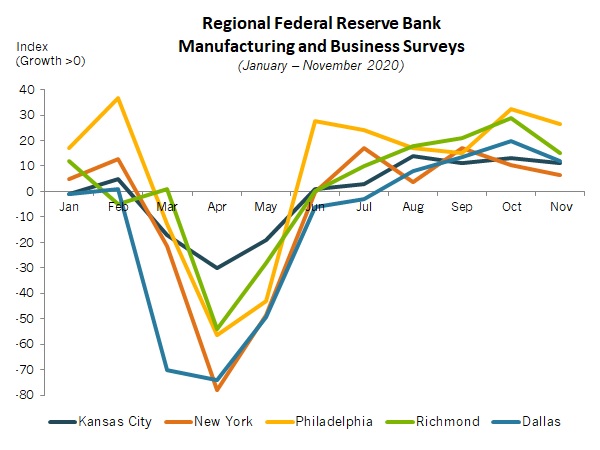
- After expanding in October at the fastest pace in two years, the Dallas Federal Reserve said that manufacturing grew at a slower rate in November, mirroring other regional surveys. Activity expanded in Texas for the fourth consecutive month, with respondents upbeat in their outlook moving forward.
- New orders for manufactured goods rose 1.0% in October, increasing for the sixth straight month. Despite notable gains since the spring, the pace of new orders remains 3.2% below the pre-pandemic pace.
- New orders for core capital goods—a proxy for capital spending in the U.S. economy—rose 0.8% to $70.1 billion in October, a new record. Encouragingly, core capital goods orders have risen a very robust 5.9% over the past 12 months.
- Manufacturing added 27,000 workers in November, rising for the seventh straight month. Employment in the sector remains well below its pre-COVID-19 pace, down by 599,000 in November relative to the level in February. The current outlook is for 12,250,000 employees in the manufacturing sector at year’s end.
- Outside of manufacturing, overall job growth eased in November. However, the unemployment rate dropped to 6.7%, as labor force participation declined once again. Overall, the labor market remains challenged with millions of Americans out of work.
- The U.S. economy added 245,000 workers in November, slowing from the gain of 610,000 in October but expanding for the seventh straight month. Among other factors, November recorded fewer government and retail trade workers. There continue to be 9,834,000 fewer nonfarm payrolls today than in February.
- The so-called “real unemployment rate”—a term that refers to those marginally attached to the workforce, including discouraged workers and the underemployed—declined from 12.1% to 12.0%.
- The percentage of the unemployed suggesting that they lost their job permanently ticked up from 3,684,000 in October to 3,743,000 in November, just shy of September’s pace (3,756,000), which was the highest since May 2013.
- While weekly initial unemployment claims were lower for the week ending Nov. 28, the data also confirm that more than 20 million Americans received some form of unemployment insurance for the week ending Nov. 14.
- Construction and trade continue to reflect some weaknesses.
- Private manufacturing construction spending fell 0.8% from $70.01 billion in September to $69.44 billion in October, falling for the fourth straight month to the slowest pace since November 2017.
- The U.S. trade deficit rose from $62.08 billion in September to $63.12 billion in October, with growth in goods imports outpacing gains in goods exports. Volumes for goods exports and service-sector trade have both fallen significantly year to date.
- U.S.-manufactured goods exports have fallen roughly 16% year to date in 2020 relative to the same 10-month period in 2019.
|
 |
|
| Economic Indicators |
|
Last Week's Indicators:
(Summaries Appear Below)
Monday, November 30
Dallas Fed Manufacturing Survey
Tuesday, December 1
Construction Spending
ISM® Manufacturing Purchasing Managers’ Index®
Wednesday, December 2
ADP National Employment Report
Thursday, December 3
Weekly Initial Unemployment Claims
Friday, December 4
BLS National Employment Report
Factory Orders and Shipments
International Trade Report
|
|
|
|
This Week's Indicators:
Monday, December 7
Consumer Credit
Tuesday, December 8
NFIB Small Business Survey
Productivity and Costs (Revision)
Wednesday, December 9
Job Openings and Labor Turnover Survey
Thursday, December 10
Consumer Price Index
Weekly Initial Unemployment Claims
Friday, December 11
Producer Price Index
University of Michigan Consumer Sentiment |
|
|
| Deeper Dive |
|
- ADP National Employment Report: Manufacturing employment rose by 8,000 in November, increasing for the seventh straight month but continuing to slow, according to ADP estimates. Despite growth since the spring, the sector has lost roughly 585,000 workers over the past 12 months, with manufacturers still trying to recover from severe declines in activity due to the COVID-19 pandemic and global recession. The 12,208,000 workers in the sector in November mark a decrease from 12,794,000 one year ago.
Overall, nonfarm private businesses added 307,000 employees in November, the smallest increase since July. However, like manufacturing, the sector’s numbers rose for the seventh consecutive month. The labor market has bounced back since dropping sharply in the spring, but with 9,722,153 fewer workers since February. Every sector other than information, which was flat, experienced increased employment in November, led by strength in leisure and hospitality (up 95,000), education and health services (up 69,000), professional and business services (up 55,000), trade, transportation and utilities (up 31,000) and construction (up 22,000).
Meanwhile, 81.1% of the net job gains in November came from small and medium-sized establishments (i.e., those with fewer than 500 employees).
- BLS National Employment Report: Manufacturing added 27,000 workers in November, rising for the seventh straight month. Despite recent gains, the labor market for the sector remains well below its pre-COVID-19 pace, with manufacturing employment down by 599,000 in November relative to the level in February. The manufacturing sector had 12,226,000 workers in November, down from 12,852,000 in February but a definite improvement from 11,489,000 employees in April. As such, sizable challenges in the economic environment continue despite movement in the right direction. The current outlook is for 12,250,000 employees in the manufacturing sector at year’s end, with continued growth next year.
In November, durable and nondurable goods employment increased by 22,000 and 5,000, respectively. The largest gains occurred in transportation equipment (up 17,800, including 15,400 from motor vehicles and parts), plastics and rubber products (up 4,600) and furniture and related products (up 3,100). At the other end of the spectrum, segments with reduced employment in November included fabricated metal products (down 2,000), chemicals (down 1,900), primary metals (down 1,700) and apparel (down 1,500).
All the major sectors continued to experience reduced employment in November relative to February. The following sectors experienced the largest decreases over that nine-month period: transportation equipment (down 125,300, with motor vehicles and parts down 72,200), fabricated metal products (down 84,700), machinery (down 55,100) and printing and related support services (down 48,000).
Meanwhile, the U.S. economy added 245,000 workers in November, slowing from the gain of 610,000 in October but expanding for the seventh straight month. November recorded fewer government and retail trade workers, with slower growth in many major sectors. Overall, there continue to be 9,834,000 fewer nonfarm payrolls today than in February.
The unemployment rate dropped from 6.9% in October to 6.7% in November, with the number of unemployed workers falling from 11,061,000 to 10,735,000. In addition, the so-called “real unemployment rate”—a term that refers to those marginally attached to the workforce, including discouraged workers and the underemployed—declined from 12.1% to 12.0%. The labor force participation rate dipped from 61.7% to 61.5%. For comparison purposes, the participation rate registered 63.3% one year ago.
Moreover, the percentage of the unemployed suggesting that they lost their job permanently ticked up from 3,684,000 in October to 3,743,000 in November, just shy of September’s pace (3,756,000), which was the highest since May 2013.
- Construction Spending: Private manufacturing construction spending fell 0.8% from $70.01 billion in September to $69.44 billion in October, falling for the fourth straight month to the slowest pace since November 2017. On a year-over-year basis, private construction spending among manufacturers has decreased 11.8% from $78.71 billion in October 2019. Total private nonresidential spending declined 0.7% in October, with a decrease of 8.2% over the past 12 months. Every major segment of private nonresidential construction spending experienced year-over-year decreases in activity except for communication and health care.
Overall, total private construction spending increased 1.4% in October, with 3.7% growth since last year. The data were buoyed by strength in the private residential construction market, which rose 2.9% in October. Single-family and multifamily construction increased 5.6% and 1.2% for the month, respectively, with year-over-year gains of 13.3% and 18.4%. Meanwhile, public construction spending rose 1.0% in October, with a gain of 3.7% increase from one year earlier.
- Dallas Fed Manufacturing Survey: After expanding in October at the fastest pace in two years, the Dallas Federal Reserve said that manufacturing grew at a slower rate in November. The composite index of general business activity declined from 19.8 in October to 12.0 in November, but expanded for the fourth straight month. Growth in new orders, production, shipments and capacity utilization decelerated in the latest survey. However, encouragingly, employment, the number of hours worked and capital spending accelerated somewhat. At the same time, raw material costs accelerated at the highest rate since October 2018.
Manufacturers in the district felt optimistic in their outlook for the next six months, even with the forward-looking composite index of business conditions dipping from 28.4 in October to 25.8 in November. More than half of respondents expect sales and production to rise over the coming months. In addition, 40.3% and 30.6% anticipate increased hiring and capital spending over the next six months, respectively.
- Factory Orders and Shipments: New orders for manufactured goods rose 1.0% in October, increasing for the sixth straight month. Durable and nondurable goods sales increased 1.3% and 0.7% in October, respectively. Despite notable gains since the spring from COVID-19 disruptions, the pace of new orders remains 3.2% below the pre-pandemic pace. On a year-over-year basis, new orders in the manufacturing sector have fallen 2.8% since October 2019. With transportation equipment excluded, factory sales have fallen 1.7% year-over-year.
Encouragingly, the durable goods data have rebounded strongly since the pandemic. Over the past 12 months, new orders for durable goods have edged down 0.2%, but with transportation equipment excluded, sales rose 4.0%. In a similar way, new orders for core capital goods (or nondefense capital goods excluding aircraft)—a proxy for capital spending in the U.S. economy—rose 0.8% to $70.1 billion in October, a new record. More importantly, core capital goods orders have risen a very robust 5.9% over the past 12 months.
Meanwhile, factory shipments also increased 1.0% in October, with durable and nondurable goods shipments up 1.3% and 0.7% for the month, respectively. Since October 2019, manufactured goods shipments have decreased 2.1%. With that said, durable goods shipments have risen 1.2% year-over-year, with 2.8% growth excluding transportation equipment. At the same time, core capital goods shipments increased 2.4% to record $69.4 billion in October, jumping 4.7% over the past 12 months.
- International Trade Report: The U.S. trade deficit rose from $62.08 billion in September to $63.12 billion in October. The increase in goods imports (up from $203.43 billion to $207.76 billion—strongest reading since September 2019) outstripped the gain in goods exports (up from $122.65 billion to $126.35 billion—the best since March). Overall, volumes for goods exports and service-sector trade remain well below the pace seen at the end of last year. For example, goods exports were $137.65 billion in December 2019, and the service-sector trade surplus has weakened from $24.30 billion to $18.29 billion year to date, with the most recent figure being the lowest since August 2012.
In October, goods exports were mostly higher across the board, including strong gains for industrial supplies and materials (up $1.62 billion), non-automotive capital goods (up $1.47 billion) and consumer goods (up $904 million). Reduced soybean exports (down $724 million) pulled foods, feeds and beverages lower. At the same time, goods imports also experienced solid gains for the month, including consumer goods (up $1.41 billion), non-automotive capital goods (up $1.38 billion), industrial supplies and materials (up $1.33 billion) and automotive vehicles and parts (up $1.01 billion).
According to the latest data, U.S.-manufactured goods exports totaled $789.87 billion through the first 10 months of 2020, using non-seasonally adjusted data, dropping 16.10% from $941.47 billion year to date in 2019.
- ISM® Manufacturing Purchasing Managers’ Index®: The Institute for Supply Management® said that manufacturing activity continued to expand solidly in November, although it slowed from October, which had recorded the fastest pace since September 2018. The headline index decreased from 59.3 in October to 57.5 in November, with some decelerated growth in new orders (down from 67.9 to 65.1) and production (down from 63.0 to 60.8). More importantly, demand and output in the sector expanded for the sixth straight month, bouncing back from steep declines from COVID-19 in the spring. Exports (up from 55.7 to 57.8) increased at the best rate since March 2018. With that said, employment (down from 53.2 to 48.4) contracted once again after rising in the previous report for the first time since July 2019.
Continued hints of lingering supply chain disruptions remain, despite solid progress since April in these data. Indeed, the index for supplier deliveries (up from 60.5 to 61.7) noted slower delivery times in November. Timothy Fiore, chair of the ISM® Manufacturing Business Survey Committee, added, “Suppliers continue to struggle to deliver, with deliveries slowing at a faster rate compared to October. Transportation challenges and challenges in supplier labor markets are still constraining production growth, the latter likely to last until COVID-19 is controlled. … Supplier constraints are not expected to diminish soon, and supplier labor issues appear to be worsening.”
Meanwhile, inventories (down from 51.9 to 51.2) expanded for the second consecutive month after shrinking for three months during the summer. However, customer inventories (down from 36.7 to 36.3) remained very low, with the index below 50 for the 50th straight month. This suggests that additional production would be necessary if demand strengthens further. In addition, prices (down from 65.5 to 65.4) increased strongly once again, highlighting strengthening raw material costs for the sixth consecutive month following deflationary pressures at the beginning of the pandemic.
- Weekly Initial Unemployment Claims: Initial unemployment claims totaled 712,000 for the week ending Nov. 28, a three-week low and down from 787,000 for the week ending Nov. 21. Initial claims have averaged 763,333 per week since the end of September and remain highly elevated, despite significant progress since peaking at 6,867,000 for the week ending March 28.
Meanwhile, continuing claims declined from 6,089,000 for the week ending Nov. 14 to 5,520,000 for the week ending Nov. 21, the lowest level in eight months. This was consistent with 3.8% of the workforce, down from 4.2% in the previous report. At the same time, 20,163,477 Americans received some form of unemployment insurance benefit (including state and federal programs) for the week ending Nov. 14, down from 20,513,110 for the week ending Nov. 7.
|
|
| Take Action |
|
- Please join me on Tuesday, Dec. 8, from 11:00 a.m. to 1:00 p.m. EST for a special webinar titled “The Digitization of the Supply Chain: The Economy, the Pandemic and Manufacturing.” This webinar will cover the myriad lessons for the manufacturing sector that have emerged as a result of the pandemic. It will highlight opportunities to improve and strengthen the supply chain and mitigate future disruptions. In addition, the webinar will include a discussion on the current economic and policy environment, as well as an economic outlook presentation from me. To register, click here.
|
|
Thank you for subscribing to the NAM’s Monday Economic Report.
If you’re part of an NAM member company and not yet subscribed, email us. If you’re not an NAM member, become one today!
|
|
|
|
|
|
|
|
|
| Interested in becoming a presenter of the Monday Economic Report? Email us. |
|
| Questions or comments? Email NAM Chief Economist Chad Moutray at [email protected]. |
|
| You received this email because you signed up for the NAM’s Monday Economic Report as a part of your NAM membership. |
|
| Manage my email newsletters and alerts | Unsubscribe |
|
 |
|
| © 2020 National Association of Manufacturers |
|
|
|
|
|
|
|
