 |
| If you’re having trouble reading this, click here. |
|
| MONDAY ECONOMIC REPORT |
|
|
|
|
| Essential Takes on Leading Economic Indicators |
|
By Chad Moutray, Ph.D., CBE – December 28, 2020 – SHARE


|
|
<
|
|
|
| Manufacturing Contributed $2.33 Trillion to the Economy in the Third Quarter |
|
| The Weekly Toplines |
|
- The U.S. economy jumped 33.4% at the annual rate in the third quarter, the largest increase in the history of the series, which dates to 1947. Despite soaring in the third quarter, real GDP remained down 3.4% year to date. The forecast for growth in the fourth (or current) quarter is 6.0%, with 4.5% growth anticipated for 2021.
- Real value-added output in the manufacturing sector rose to $2.213 trillion in the third quarter, as expressed in chained 2012 dollars. It remained down 1.0% from the all-time high recorded in the fourth quarter of 2019 ($2.236 trillion), despite tremendous volatility year-to-date. Overall, manufacturing accounted for 11.0% of real GDP in the third quarter, with value-added output (in nominal terms) up to $2.329 trillion, just 1.7% from a record high.
- In the latest NAM Manufacturers’ Outlook Survey, 74.2% of respondents were either somewhat or very positive about the outlook for their company. It represented notable improvement after the 33.9% and 66.0% readings in the second and third quarters, respectively.
- Just over 29% of manufacturers said that their revenues will have recovered either before or during the fourth quarter, and 67.7% anticipate that their revenues will be back to pre-pandemic levels by the end of 2021. After two quarters with weaker domestic demand topping the list of primary business challenges, the inability to attract and retain talent led the pack once again in the fourth quarter.
- New orders for durable goods rose 0.9% in November, rising for the seventh straight month. Overall, the durable goods manufacturing sector has bounced back soundly following steep declines in March and April due to the COVID-19 pandemic. On a year-over-year basis, new durable goods orders have grown by 3.8% since November 2019.
- Orders for nondefense capital goods excluding aircraft—a proxy for capital spending in the U.S. economy—increased 0.4% to $70.90 billion in November, a new monthly record.
- Manufacturing businesses in the Richmond Federal Reserve Bank’s district expanded for the sixth straight month, and respondents expect continued growth over the next six months.
- In last week’s releases for December, the Conference Board and the University of Michigan provided mixed news on consumer confidence. However, Americans were cautiously upbeat in their outlook, despite assessments of the economy being well below levels seen before the pandemic.
- Personal consumption expenditures declined 0.4% in November, falling for the first time since April. The savings rate remained elevated at 12.9%. These data suggest that Americans were more hesitant in their consumer spending in November—something that will not be welcome news for retailers heading into the holiday season. Over the past 12 months, personal spending has fallen 1.3% since November 2019, largely on reduced spending for services.
- Meanwhile, personal income fell 1.1% in November, but it has risen by 3.8% year-over-year. Manufacturing wages and salaries increased to $955.2 billion in November, with 3.7% growth over the past 12 months.
- Existing and new home sales both pulled back in November, but activity remained very robust on a year-over-year basis. The housing market continued to be a bright spot, buoyed by historically low mortgage rates. However, inventories remain very low, pushing prices higher.
Note: The Monday Economic Report will not be published on January 4, 2021. The next issue will be released on Monday, January 11.
|
 |
|
| Economic Indicators |
|
Last Week's Indicators:
(Summaries Appear Below)
Monday, December 21
Chicago Fed National Activity Index
Tuesday, December 22
Conference Board Consumer Confidence
Existing Home Sales
Gross Domestic Product (Second Revision)
Real GDP by Industry
Richmond Fed Manufacturing Survey
Wednesday, December 23
Durable Goods Orders and Shipments
NAM Manufacturers’ Outlook Survey
New Home Sales
Personal Consumption Expenditures Deflator
Personal Income and Spending
University of Michigan Consumer Sentiment (Revision)
Weekly Initial Unemployment Claims
Thursday, December 24
None
Friday, December 25
CHRISTMAS DAY HOLIDAY
|
|
|
|
This Week's Indicators:
Monday, December 28
Dallas Fed Manufacturing Survey
Tuesday, December 29
None
Wednesday, December 30
International Trade in Goods (Preliminary)
Thursday, December 31
Weekly Initial Unemployment Claims
Friday, January 1
NEW YEARS DAY HOLIDAY
|
|
|
| Deeper Dive |
|
- Chicago Fed National Activity Index: The Chicago Federal Reserve Bank’s National Activity Index slowed from 1.01 in October to 0.27 in November, but the data remained positive for the seventh straight month. Readings above zero are consistent with the U.S. economy expanding above its historical trend. The three-month moving average also eased, down from 0.85 in October to 0.56 in November. This report continues to provide some encouragement that the nation is beyond the worst of the recession, even as challenges persist and overall growth is decelerating.
For its part, manufacturing production rose 0.8% in November, expanding for the seventh consecutive month. Despite progress since the spring, output in the sector remained 3.7% below the pre-pandemic level seen in February. As a result, production-related indicators added 0.11 to November’s NAI, down from contributing 0.36 in October. Employment-related indicators also slowed, but they added 0.15 to the topline. In contrast, personal consumption and housing indicators subtracted 0.09. Manufacturers added 27,000 workers in November, and the unemployment rate fell to 6.7%.
- Conference Board Consumer Confidence: According to the Conference Board, consumer confidence dipped from 92.9 in November to 88.6 in December, a four-month low. Sentiment has decreased as new COVID-19 restrictions are imposed in many areas. With that said, Americans were also cautiously more upbeat in their outlook for six months from now.
Respondents had a weakened assessment of the labor market, with the percentage of respondents feeling jobs were “plentiful” decreasing from 26.3% to 21.8%. At the same time, those saying jobs were “hard to get” rose from 19.4% to 22.0%. In addition, the percentage of respondents suggesting that business conditions were “good” edged down from 18.8% to 16.0%, while the percentage feeling that conditions were “bad” increased from 34.9% to 39.5%.
Yet, respondents also expressed optimism for stronger economic conditions moving forward. The percentage of consumers anticipating better business conditions over the next six months increased from 26.5% to 29.0%, with those predicting a worsening of conditions ticking down from 22.5% to 21.9%. At the same time, the percentage of respondents expecting more jobs in the next six months rose from 25.0% to 27.5%, with those expecting fewer jobs inching up from 21.6% to 22.2%.
- Durable Goods Orders and Shipments: New orders for durable goods rose 0.9% in November, building on the 1.8% gain in October and rising for the seventh straight month. Overall, the durable goods manufacturing sector has bounced back soundly following steep declines in March and April due to the COVID-19 pandemic. Excluding transportation equipment, new durable goods orders increased 0.4% in November. Orders for nondefense capital goods excluding aircraft—a proxy for capital spending in the U.S. economy—also rose by 0.4% from $70.63 billion in October to $70.90 billion in November, a new monthly record.
On a year-over-year basis, new durable goods orders have grown by 3.8% since November 2019, or a 4.8% increase with transportation equipment excluded. Core capital goods orders have risen 6.2% over the past 12 months. In November, new orders rose for computer and electronic products, electrical equipment and appliances, machinery, motor vehicles and parts and primary metals, among others. In contrast, sales declined for fabricated metal products and nondefense aircraft and parts.
Meanwhile, shipments of durable goods increased 0.3% in November, slowing from the 1.5% gain experienced in October. Over the past 12 months, durable goods shipments have risen by 1.9%. Excluding transportation, shipments have increased 3.6% year-over-year. In addition, core capital goods shipments grew 0.4% from $69.58 billion in October to $69.89 billion in November, an all-time high, with 5.6% growth year-over-year.
- Existing Home Sales: After jumping in October to the highest level since February 2006, existing home sales dropped 2.5% from 6.86 million units in October to 6.69 million units in November, according to the National Association of Realtors. In November, single-family and condominium/co-op sales declined 2.4% and 2.7%, respectively. Nonetheless, the housing market continues to be a bright spot, buoyed by historically low mortgage rates. Over the past 12 months, existing home sales have risen 25.8%, up from 5.32 million units in November 2019. Single-family sales jumped 25.6% year-over-year, with condo/co-op sales up 26.8% from the pace one year ago.
With the pickup in activity, inventories narrowed sharply from 2.5 months of supply in October to just 2.3 months in November, a record low. The median sales price for existing homes has increased 14.6% year-over-year, up to $310,800 in November.
- Gross Domestic Product (Second Revision): The U.S. economy jumped 33.4% at the annual rate in the third quarter, the largest increase in the history of the series, which dates to 1947. This follows the steepest decline in history in the second quarter, when the economy contracted by 31.4% at the annual rate due to COVID-19. The latest data include slight upward revisions to consumer spending and nonresidential fixed investment, with a downward revision to exports. Despite soaring in the third quarter, real GDP remained down 3.4% year to date. The forecast for growth in the fourth (or current) quarter is 6.0%, with 4.5% growth anticipated for 2021.
Breaking down the details in this report:
- Personal consumption expenditures jumped by an annualized 41.0% in the third quarter, bouncing back from the 33.2% decline in the second quarter and contributing 25.44% to the increase in real GDP for the third quarter. Durable and nondurable goods spending soared 82.7% and 31.1%, respectively. Service-sector spending also increased robustly, up 38.0% in the third quarter following decreases in the first and second quarters of 9.8% and 41.8%, respectively.
- Business investment also rose strongly, soaring 86.3% at the annual rate in the third quarter following declines in the previous three quarters. In the third quarter, nonresidential and residential fixed investment rose 22.9% and 63.0%, respectively. Spending was solid for business equipment and intellectual property products, and the housing market remained a bright spot. However, investments in equipment declined for the fourth straight quarter. Overall, business fixed investment added 5.39% to topline GDP growth in the third quarter, with spending on inventories contributing another 6.57%.
- Net exports subtracted 3.21% from topline growth in the third quarter, the first negative contribution since the first quarter of 2019. Trade activity bounced back strongly, with exports and imports rising 59.6% and 93.1% at annual rates, respectively. Yet, imports have recovered faster than exports. Real goods exports have declined 9.9% year to date, with real goods imports off 1.6% over that time frame.
- Government spending subtracted 0.75% from real GDP growth in the third quarter. Federal government spending fell 6.2% at the annual rate in the third quarter, pulling back sharply after jumping 16.4% in the second quarter on increased transfer payments. At the same time, state and local government spending dropped 3.9% in the third quarter, extending the 5.4% decline in the second quarter and highlighting economic challenges.
- NAM Manufacturers’ Outlook Survey: In the fourth quarter, 74.2% of respondents were either somewhat or very positive about the outlook for their company. This was roughly equivalent to the historical average of 74.4%, and it represented notable improvement after the 33.9% and 66.0% readings in the second and third quarters, respectively. The second quarter survey reported activity that was the worst since the Great Recession.
In the latest data, 42.1% of manufacturers report higher production in the fourth quarter than in the third, with 31.3% predicting output will be lower and 25.8% feeling there will be no change. At the same time, 57.1% and 55.4% of those completing the survey anticipate no change in the fourth quarter in hiring and capital spending, respectively, and 26.3% and 22.3% expecting increased employment and investment.
Respondents were asked when they expect revenues to return to pre-pandemic levels. Just over 29% said that their revenues will have recovered either before or during the fourth quarter, with 38.3% expecting their revenues to return to normal at some point in 2021. As such, 67.7% of manufacturers completing this survey anticipate that their revenues will be back to pre-pandemic levels by the end of 2021, with 86.2% saying revenues will recover by the end of 2022.
After two quarters with weaker domestic demand topping the list of primary business challenges, the inability to attract and retain talent led the pack once again in the fourth quarter. Prior to the COVID-19 pandemic, workforce challenges had been the primary concern for 10 consecutive quarters, and its reemergence at the top of this list reflects the structural- skills mismatches that many manufacturers face regarding employment. The weaker domestic economy fell to second place, with 50.4%. Other top worries included rising health care and insurance costs (50.2%) and increased raw material costs (43.2%).
Manufacturers were asked about their policy priorities for the incoming Biden administration and the 117th Congress. Their top responses related to their bottom line, with 67.1% citing a desire for reduced regulatory burdens. That was followed by a request for controlling rising health care costs (59.1%) and retaining and strengthening tax reform (57.6%). In addition, 52.9% and 46.4% appealed for slowing the growth of entitlement spending and finding a long-term deal that tackles the deficit and debt, respectively.
- New Home Sales: New single-family home sales declined 11.0% from 945,000 units at the annual rate in October to 841,000 units in November, decreasing for the fourth straight month. July’s figures (979,000 units) had marked the best level since December 2006. Sales fell in every region of the country in November. Despite pulling back in the latest data, the housing market remains strong overall, buoyed by historically low mortgage rates. Over the past 12 months, new single-family home sales have jumped 20.8%, up from 696,000 units in November 2019 and with robust gains in each region of the country except the Midwest.
Inventories of new homes for sale rose from 3.6 months of supply in October to 4.1 months in November. Yet, inventories remain very low overall, in comparison to the 5.6 months of supply on the market one year ago. The median sales price registered $335,300 in November, up 2.2% year-over-year.
- Personal Consumption Expenditures Deflator: In November, the PCE deflator was flat for the second straight month. The latest data suggest that, after experiencing sharp deflationary pressures in March and April at the beginning of the COVID-19 pandemic, costs have stabilized. Overall, the PCE deflator has risen 1.1% year-over-year, and core inflation, which excludes food and energy costs, has increased 1.4% over the past 12 months. Energy prices rose 0.4% in November, but food costs edged down 0.1%. On a year-over-year basis, energy prices have fallen 9.9%, with food prices up 3.7%.
Despite higher costs in recent months, the core PCE deflator has remained below 2% for 24 consecutive months. More than anything, the Federal Reserve remains more worried about economic growth than inflation, as seen in the extraordinary measures taken over the past few months to help prop up the economy and to address credit and liquidity concerns in financial markets.
- Personal Income and Spending: Personal consumption expenditures declined 0.4% in November, falling for the first time since April. Durable and nondurable goods purchases fell 1.7% and 0.6% in November, respectively, with service-sector spending off 0.2%. These data suggest that Americans were more hesitant in their consumer spending in November—something that will not be welcome news for retailers heading into the holiday season. Along those lines, the savings rate continued to be highly elevated at 12.9% in November, down from 13.6% in October. The saving rate averaged 7.5% in 2019, suggesting some lingering caution in purchasing, despite progress in the economy since the depths of the pandemic.
Over the past 12 months, personal spending has fallen 1.3% since November 2019. Consumers spent 4.9% less on services in November than one year earlier. More encouragingly, durable and nondurable goods spending rose 13.0% and 3.8% year-over-year, respectively.
Meanwhile, personal income fell 1.1% in November, extending the 0.6% decline seen in October. The data have been influenced heavily by transfer payments over the past few months. Unemployment insurance has soared from $27.8 billion in February to $1.40 trillion in June. However, it declined each month since then to $277.4 billion in November. In addition, government assistance checks were largely responsible for the 12.2% increase in personal income in April. Overall, personal income has risen 3.8% since November 2019.
Wages and salaries rose 0.4% in November, with 2.0% growth over the past 12 months. Manufacturing wages and salaries increased from $949.4 billion in October to $955.2 billion in November, with 3.7% growth over the past 12 months.
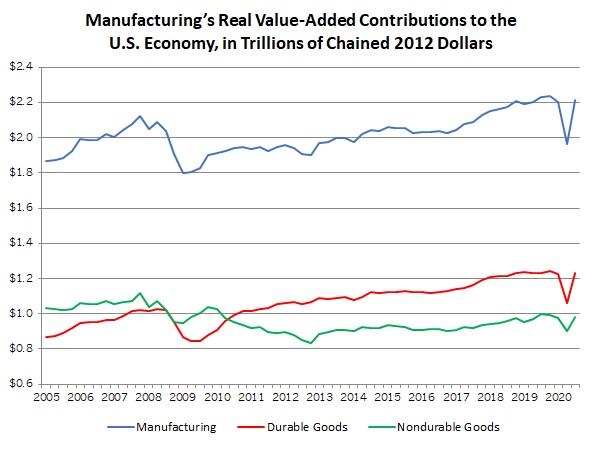
- Real GDP by Industry: The U.S. economy rose 33.4% at the annual rate in the third quarter. According to the Bureau of Economic Analysis, real value-added output in the manufacturing sector jumped from $1.963 trillion at the annualized rate in the second quarter to $2.213 trillion in the third quarter, as expressed in chained 2012 dollars. As such, activity in the sector rebounded strongly after plummeting in the first half of 2020, with real manufacturing value-added output down just 1.0% from the all-time high recorded in the fourth quarter of 2019 ($2.236 trillion). In the latest data, real value-added output for durable goods increased from $1.061 trillion to $1.230 trillion, with nondurable goods activity up from $902.5 billion to $982.4 billion.
Overall, manufacturing added 5.98 percentage points to real GDP in the third quarter, bouncing back after subtracting 4.10 percentage points in the second quarter. Manufacturing accounted for 11.0% of real GDP in the third quarter, up from 10.5% in the second quarter.
Digging into the data, manufacturing value-added output increased from $2.054 trillion in the second quarter to $2.329 trillion in the third quarter, which was 1.7% below the record pace seen in the fourth quarter of 2019 ($2.370 trillion). Similarly, manufacturing gross output soared from $5.333 trillion in the second quarter to $6.013 trillion in the third quarter. However, it remained 3.7% lower than one year earlier ($6.249 trillion in the third quarter of 2019).
- Richmond Fed Manufacturing Survey: Manufacturing businesses in the Richmond Federal Reserve Bank’s district expanded for the sixth straight month, with the composite index of general business activity rising from 15 in November to 19 in December. New orders, capacity utilization, employment, the average workweek and capital spending each accelerated somewhat in December, while shipments growth slowed a bit. Spending on services contracted once again following three straight months of being flat. Meanwhile, the forward-looking indicators remained encouraging, despite some slippage from the previous survey. These results suggest that manufacturers in the region expect continued growth in activity over the next six months.
Raw material costs eased from 2.18% at the annual rate in November to 2.10% in December. In addition, respondents anticipate an annualized 2.76% increase in costs six months from now, up from 2.36% in the prior survey and the fastest pace since February.
- University of Michigan Consumer Sentiment (Revision): Consumer confidence rose from 76.9 in November to 80.7 in December, according to final data from the University of Michigan and Thomson Reuters. That was lower than the original estimate of 81.4. Overall, Americans felt more upbeat in their assessments of both current economic conditions and the outlook for the coming months. Wide disparities exist along partisan lines, with Democrats feeling more positive than Republicans post-election (a reversal of the previous trend). Overall, consumer confidence remains well below the levels before the pandemic. The Index of Consumer Sentiment averaged 81.6 in 2020, down from 98.4 and 96.0 in 2018 and 2019, respectively.
- Weekly Initial Unemployment Claims: Initial unemployment claims totaled 803,000 for the week ending Dec. 19, pulling back after rising in the previous two weekly reports. The week ending Dec. 12 recorded 892,000 claims, which was the highest level since the week ending Sept. 5. Initial unemployment claims have averaged 852,333 per week so far in December, up from the average of 740,500 seen in the four weeks of November. The recent uptick reflects some softening in the labor market due to the continued spread of COVID-19 and new restrictions on activity. Overall, the data remain elevated, despite significant progress since peaking at 6,867,000 for the week ending Mar. 28.
Meanwhile, continuing claims declined from 5,507,000 for the week ending Dec. 5 to 5,337,000 for the week ending Dec. 12, consistent with 3.6% of the workforce. This figure represents the lowest level since the week ending Mar. 21. At the same time, 20,363,675 Americans received some form of unemployment insurance benefit (including state and federal programs) for the week ending Dec. 5. This figure represents a decline from 20,646,845 for the week ending Nov. 28, largely on a reduction in state assistance.
|
|
|
Thank you for subscribing to the NAM’s Monday Economic Report.
If you’re part of an NAM member company and not yet subscribed, email us. If you’re not an NAM member, become one today!
|
|
|
|
|
|
|
|
|
| Interested in becoming a presenter of the Monday Economic Report? Email us. |
|
| Questions or comments? Email NAM Chief Economist Chad Moutray at [email protected]. |
|
| You received this email because you signed up for the NAM’s Monday Economic Report as a part of your NAM membership. |
|
| Manage my email newsletters and alerts | Unsubscribe |
|
 |
|
| © 2020 National Association of Manufacturers |
|
|
|
|
|
|
|
