 |
| If you’re having trouble reading this, click here. |
|
| MONDAY ECONOMIC REPORT |
|
|
|
|
| Essential Takes on Leading Economic Indicators |
|
By Chad Moutray, Ph.D., CBE – January 11, 2021 – SHARE


|
|
<
|
|
|
Manufacturing a Bright Spot in December Labor Data |
|
| The Weekly Toplines |
|
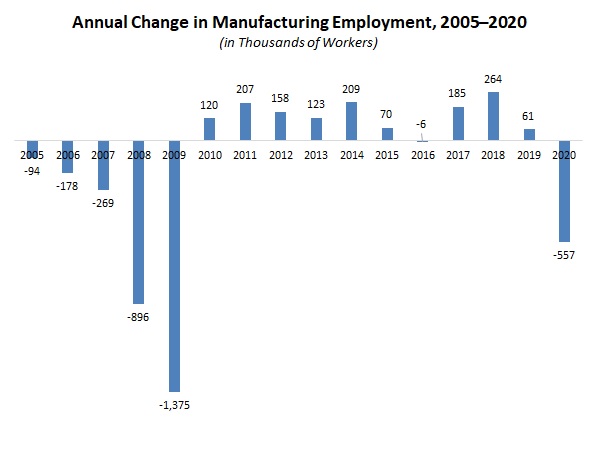
- Manufacturing added 38,000 workers in December, rising for the eighth straight month and making the sector one of the bright spots in an otherwise disappointing (but expected) report. Yet, the manufacturing sector lost 557,000 workers in 2020, the largest annual decline since 2009 and ending three years of gains.
- The U.S. economy lost 140,000 workers in December, the first monthly decline in nonfarm payroll employment since April and weighed down by weaknesses in the service sector and state and local government. The unemployment rate remained flat at 6.7% in December.
- Initial unemployment claims totaled 787,000 for the week ending Jan. 2. First-time claims have averaged 784,250 over the past 12 weeks, highlighting just how little these data have moved in the past three months. The data remain elevated, despite significant progress since peaking at 6,867,000 for the week ending March 28.
- The Institute for Supply Management® reported that manufacturing activity continued to expand solidly in December, ending the year at the fastest pace of growth since August 2018. Growth in new orders matched the pace in October, which was the best since January 2004, and hiring expanded for just the second time since July 2019, with some respondents noting ongoing difficulties in finding talent.
- The ISM® report also noted lingering supply chain disruptions remain, despite solid progress since April in these data, including supplier labor and transportation constraints. Raw material costs rose at the swiftest rate since May 2018.
- New orders for manufactured goods rose 1.0% in November, increasing for the seventh straight month. Despite notable gains since the spring from COVID-19 disruptions, new orders remain 1.9% below the pre-pandemic pace.
- Encouragingly, the durable goods data have rebounded strongly since the pandemic. Over the past 12 months, new orders for durable goods have increased 3.9%, but with transportation equipment excluded, sales rose a solid 4.9% year-over-year.
- Private manufacturing construction spending edged up 0.1% to $69.54 billion in November. The data have stabilized but have remained little changed over the past three months, settling at a pace that remains well below what was seen before the pandemic. On a year-over-year basis, private construction spending among manufacturers has decreased 15.1% from $81.88 billion in November 2019.
- The U.S. trade deficit rose from $63.11 billion in October to $68.14 billion in November, the highest since August 2006. Goods exports remain well below the pre-pandemic pace, and the service-sector trade surplus was the lowest since August 2012. U.S.-manufactured goods exports have fallen 15.7% year to date in 2020 relative to the same 11-month time period in 2019.
|
 |
|
| Economic Indicators |
|
Last Week's Indicators:
(Summaries Appear Below)
Monday, January 4
Construction Spending
Tuesday, January 5
ISM® Manufacturing Purchasing Managers’ Index®
Wednesday, January 6
ADP National Employment Report
Factory Orders and Shipments
Thursday, January 7
International Trade Report
Weekly Initial Unemployment Claims
Friday, January 8
BLS National Employment Report
|
|
|
|
This Week's Indicators:
Monday, January 11
None
Tuesday, January 12
Job Openings and Labor Turnover Survey
NFIB Small Business Survey
Wednesday, January 13
Consumer Price Index
Thursday, January 14
Philadelphia Fed Manufacturing Survey
Weekly Initial Unemployment Claims
Friday, January 15
Industrial Production
New York Fed Manufacturing Survey
Producer Price Index
Retail Sales |
|
|
| Deeper Dive |
|
- ADP National Employment Report: Manufacturing employment fell by 21,000 in December, declining for the first time since April, according to ADP estimates. Overall, the labor market was weaker at year’s end, as economic growth slowed due to rising COVID-19 cases and new restrictions. Nonfarm private business employment decreased by 123,000 in December, ending seven straight months of gains. Over the past 12 months, private nonfarm payrolls have fallen by nearly 9,500,000, with manufacturing employment down 605,000 year-over-year.
In addition to manufacturing, the sectors with the largest declines in December included leisure and hospitality (down 58,000), trade, transportation and utilities (down 50,000), other services (down 12,000) and information (down 6,000). In contrast, professional and business services (up 12,000) and education and health services (up 8,000) increased hiring in December.
Meanwhile, medium-sized businesses (i.e., those with 50 to 499 employees) added 37,000 workers in December, but that was more than offset by declines for small (i.e., those with fewer than 50 employees) and large (i.e., those with 500 or more employees) businesses, which shed 160,000 workers in total.
- BLS National Employment Report: Manufacturing added 38,000 workers in December, rising for the eighth straight month and making the sector one of the bright spots in an otherwise disappointing (but expected) report. Despite gains since the spring, the labor market for the sector remains well below its pre-COVID-19 pace, with manufacturing employment down by 543,000 in December relative to the level in February. The manufacturing sector had 12,309,000 workers in December, down from 12,852,000 in February but a definite improvement from 11,489,000 employees in April. Overall, the manufacturing sector lost 557,000 workers in 2020, the largest annual decline since 2009 and ending three years of gains.
In December, durable and nondurable goods employment increased by 25,000 and 13,000, respectively. Employment increased in every manufacturing sector except for three: miscellaneous nondurable goods (down 11,200), primary metals (down 2,100) and textile mills (down 100). In contrast, the largest gains for the month included plastics and rubber products (up 6,900), nonmetallic mineral products (up 6,100), food manufacturing (up 5,500), transportation equipment (up 5,200) and apparel (up 4,000).
All the major sectors continued to experience reduced employment in December relative to February. The following sectors experienced the largest decreases over that 10-month period: transportation equipment (down 124,500), fabricated metal products (down 80,500), machinery (down 59,400) and printing and related support services (down 47,600). At the other end of the spectrum, plastics and rubber products (down 1,400), computer and electronics products (down 5,600), textile product mills (down 7,500) and paper and paper products (down 8,200) fared better, with the smallest declines in employment since February.
Meanwhile, the U.S. economy lost 140,000 workers in December, the first monthly decline in nonfarm payroll employment since April and weighed down by weaknesses in the service sector, specifically in leisure and hospitality (down 498,000) and educational services (down 62,500). The recent surge in COVID-19 cases has led to more restrictions, hurting those sectors. In addition, state and local governments continue to struggle financially, with 51,000 fewer workers in December. Overall, there continue to be 9,839,000 fewer nonfarm payrolls today than in February.
The unemployment rate remained flat at 6.7% in December, with the number of unemployed workers little changed from 10,728,000 to 10,736,000. The so-called “real unemployment rate”—a term that refers to those marginally attached to the workforce, including discouraged workers and the underemployed—declined from 12.0% to 11.7%. The labor force participation rate also remained at 61.5%, but for comparison purposes, the participation rate registered 63.3% one year ago.
- Construction Spending: Private manufacturing construction spending edged up 0.1% from $69.48 billion in October to $69.54 billion in November. The data have stabilized but have remained little changed over the past three months, settling at a pace that remains well below what was seen before the pandemic. On a year-over-year basis, private construction spending among manufacturers has decreased 15.1% from $81.88 billion in November 2019. Total private nonresidential spending declined 0.8% in November, with a decrease of 9.5% over the past 12 months. Every major segment of private nonresidential construction spending experienced year-over-year decreases in activity in the latest figures.
Overall, total private construction spending increased 1.2% in November, with 4.1% growth since last year. The data were buoyed by strength in the private residential construction market, which rose 2.7% in November. Single-family construction increased 5.1%, but multifamily activity was flat for the month. Over the past 12 months, single-family and multifamily construction jumped 18.1% and 15.8%, respectively. Meanwhile, public construction spending inched down 0.2% in November, but with a gain of 3.1% from one year earlier.
- Factory Orders and Shipments: New orders for manufactured goods rose 1.0% in November, increasing for the seventh straight month. Durable and nondurable goods sales increased 1.0% and 1.1% in November, respectively. Despite notable gains since the spring from COVID-19 disruptions, new orders remain 1.9% below the pre-pandemic pace. On a year-over-year basis, new orders in the manufacturing sector have fallen 0.4% since November 2019. With transportation equipment excluded, factory sales increased 0.8% in November, but with a decline of 0.8% year-over-year.
Encouragingly, the durable goods data have rebounded strongly since the pandemic. Over the past 12 months, new orders for durable goods have increased 3.9%, but with transportation equipment excluded, sales rose a solid 4.9% year-over-year. Similarly, new orders for core capital goods (or nondefense capital goods excluding aircraft)—a proxy for capital spending in the U.S. economy—rose 0.5% to $71.0 billion in November, a new record. More importantly, core capital goods orders have risen a robust 6.4% over the past 12 months.
Meanwhile, factory shipments increased 0.7% in November, with durable and nondurable goods shipments up 0.3% and 1.1% for the month, respectively. Since November 2019, manufactured goods shipments have decreased 1.3%. With that said, durable goods shipments have risen 1.9% year-over-year, with 3.6% growth excluding transportation equipment. At the same time, core capital goods shipments rose 0.5% to a record $69.9 billion in November, jumping 5.7% over the past 12 months.
- International Trade Report: The U.S. trade deficit rose from $63.11 billion in October to $68.14 billion in November, the highest since August 2006. The increase in goods imports (up from $207.76 billion to $214.08 billion—the strongest reading since May 2019) outstripped the gain in goods exports (up from $126.41 billion to $127.73 billion—the best since March). Overall, volumes for goods exports and service-sector trade remain well below the pace seen at the end of last year. For example, goods exports were $137.65 billion in December 2019, and the service-sector trade surplus has weakened from $24.30 billion to $18.21 billion year to date, with the most recent figure being the lowest since August 2012.
In November, goods exports increased for foods, feeds and beverages (up $536 million), industrial supplies and materials (up $830 million) and consumer goods (up $176 million), which was enough to offset declines for automotive vehicles, parts and engines (down $125 million) and non-automotive capital goods (down $241 million). At the same time, goods imports also experienced solid gains for the month, including consumer goods (up $4.00 billion), industrial supplies and materials (up $1.51 billion) and non-automotive capital goods (up $1.20 billion). Consumer goods imports were the highest on record. In contrast, automotive vehicles, parts and engines decreased $1.04 billion in November.
According to the latest data, U.S.-manufactured goods exports totaled $871.71 billion through the first 11 months of 2020, using non-seasonally adjusted data, dropping 15.72% from $1,034.32 billion year to date in 2019.
- ISM® Manufacturing Purchasing Managers’ Index®: The Institute for Supply Management® reported that manufacturing activity continued to expand solidly in December, ending the year at the fastest pace of growth since August 2018. The headline index rose from 57.5 in November to 60.7 in December, with new orders (up from 65.1 to 67.9) and production (up from 60.8 to 64.8) both accelerating. Sales growth matched the pace in October, which was the best since January 2004. Employment (up from 48.4 to 51.5) rebounded in December, expanding for just the second time since July 2019, with some respondents noting ongoing difficulties in finding talent. Exports (down from 57.8 to 57.5) pulled back slightly from the fastest rate since March 2018 but remained strong.
Continued hints of lingering supply chain disruptions remain, despite solid progress since April in these data. Indeed, the index for supplier deliveries (up from 61.7 to 67.6) noted slower delivery times in December. Timothy Fiore, chair of the ISM® Manufacturing Business Survey Committee, said, “Suppliers continue to struggle to deliver, with deliveries slowing at a faster rate compared to November. Transportation challenges and challenges in supplier-labor markets are still constraining production growth….” He added, “Supplier labor and transportation constraints are not expected to diminish in the near-to-moderate term due to COVID-19.”
Meanwhile, inventories (up from 51.2 to 51.6) expanded for the third consecutive month, but customers’ inventories (up from 36.3 to 37.9) remained very low, with the index below 50 for the 51st straight month. This suggests that additional production would be necessary if demand strengthens further. In addition, prices (up from 65.4 to 77.6) increased robustly, rising at the swiftest rate since May 2018, highlighting strengthening raw material costs in light of increased economic activity and—as noted above—lingering supply chain constraints.
- Weekly Initial Unemployment Claims: Initial unemployment claims totaled 787,000 for the week ending Jan. 2, pulling back slightly from 790,000 claims for the week ending Dec. 26 and the third consecutive decline. First-time claims have averaged 784,250 over the past 12 weeks, highlighting just how little these data have moved in the past three months. The data remain elevated, despite significant progress since peaking at 6,867,000 for the week ending March 28.
Meanwhile, continuing claims declined from 5,198,000 for the week ending Dec. 19 to 5,072,000 for the week ending Dec. 26, consistent with 3.5% of the workforce. This figure represents the lowest level since the week ending March 21. At the same time, 19,176,857 Americans received some form of unemployment insurance benefit (including state and federal programs) for the week ending Dec. 19. This figure represents a decline from 19,596,085 for the week ending Dec. 12, largely on reductions in state and pandemic assistance.
|
|
|
Thank you for subscribing to the NAM’s Monday Economic Report.
If you’re part of an NAM member company and not yet subscribed, email us. If you’re not an NAM member, become one today!
|
|
|
|
|
|
|
|
|
| Interested in becoming a presenter of the Monday Economic Report? Email us. |
|
| Questions or comments? Email NAM Chief Economist Chad Moutray at [email protected]. |
|
| You received this email because you signed up for the NAM’s Monday Economic Report as a part of your NAM membership. |
|
| Manage my email newsletters and alerts | Unsubscribe |
|
 |
|
| © 2021 National Association of Manufacturers |
|
|
|
|
|
|
|
