 |
| If you’re having trouble reading this, click here. |
|
| MONDAY ECONOMIC REPORT |
|
|
|
|
| Essential Takes on Leading Economic Indicators |
|
By Chad Moutray, Ph.D., CBE – February 1, 2021 – SHARE


|
|
<
|
|
|
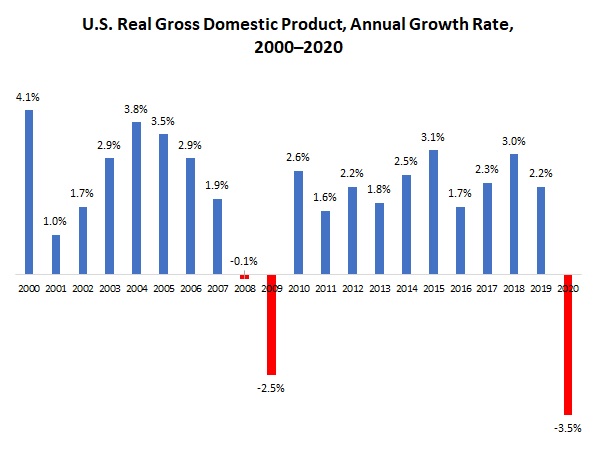
| U.S. Economy Shrank 3.5% in 2020, Largest Annual Decline Since 1946 |
|
| The Weekly Toplines |
|
- The U.S. economy grew 4.0% at the annual rate in the fourth quarter—a reading that was weaker than expected as consumer spending on goods was relatively flat with COVID-19 cases on the rise and renewed restrictions placed in many areas. Residential and nonresidential business spending, inventories and service-sector consumption were bright spots.
- Real GDP shrank 3.5% in 2020, the largest annual decline in economic activity since 1946. The U.S. economy is expected to rebound in 2021, especially as more Americans get vaccinated and market participants resume some semblance of normalcy in their actions. The current forecast is for 4.8% growth in 2021.
- Personal consumption expenditures declined 0.2% in December, suggesting that Americans were more hesitant in their spending at year’s end, particularly with rising COVID-19 cases and restrictions in many markets. The saving rate continued to be highly elevated at 13.7% in December. Yet, over the past year, personal spending fell largely on reduced service-sector spending, not goods.
- The consumer confidence data for January provided mixed results, but both surveys reflected a lessened assessment of current economic conditions. Encouragingly, respondents felt more optimistic about better conditions over the coming months.
- New orders for durable goods rose 0.2% in December. Overall, the durable goods sector has rebounded solidly following steep declines in activity last spring due to the COVID-19 pandemic. On a year-over-year basis, new durable goods orders have grown 1.4% since December 2019, or a relatively strong 6.5% increase with transportation equipment excluded.
- The Dallas, Kansas City and Richmond Federal Reserve Banks each reported rising manufacturing activity in January, and survey respondents remained upbeat in their outlook for the next six months. At the same time, raw material costs escalated sharply, particularly with lingering supply chain constraints in the market.
- The Federal Reserve kept short-term interest rates unchanged, as expected, but also noted, “The path of the economy will depend significantly on the course of the virus, including progress on vaccinations.” The Federal Open Market Committee will reevaluate its monetary policy stance based on incoming data, but it is widely expected to keep interest rates unchanged for at least all of 2021.
- The PCE deflator rose 0.4% in December. It increased 1.3% year-over-year, and core inflation, which excludes food and energy costs, has increased 1.5% over the past 12 months. Despite higher costs recently, the core PCE deflator has remained below 2% for 25 consecutive months.
- New single-family home sales rose 1.6% at the annual rate in December, with activity continuing to be buoyed by mortgage rates that are near historic lows. Over the past 12 months, new single-family home sales have jumped 15.2%, but inventories remain very low.
|
 |
|
| Economic Indicators |
|
Last Week's Indicators:
(Summaries Appear Below)
Monday, January 25
Chicago Fed National Activity Index
Dallas Fed Manufacturing Survey
Tuesday, January 26
Conference Board Consumer Confidence
Richmond Fed Manufacturing Survey
State Employment Report
Wednesday, January 27
Business Employment Dynamics
Durable Goods Orders and Shipments
FOMC Monetary Policy Statement
Thursday, January 28
Conference Board Leading Indicators
Gross Domestic Product (Fourth Quarter 2020)
International Trade in Goods (Preliminary)
Kansas City Fed Manufacturing Survey
New Home Sales
Weekly Initial Unemployment Claims
Friday, January 29
Employment Cost Index
Personal Consumption Expenditures Deflator
Personal Income and Spending
University of Michigan Consumer Sentiment |
|
|
|
This Week's Indicators:
Monday, February 1
Construction Spending
ISM® Manufacturing Purchasing Managers’ Index®
Tuesday, February 2
None
Wednesday, February 3
ADP National Employment Report
Thursday, February 4
Factory Orders and Shipments
Productivity and Costs
Weekly Initial Unemployment Claims
Friday, February 5
BLS Employment Report
International Trade Report |
|
|
| Deeper Dive |
|
- Business Employment Dynamics: Manufacturing experienced a net decrease of 888,000 jobs in the second quarter of 2020, extending the net decline of 54,000 in the first quarter. Manufacturers had gross job gains of 272,000 in the second quarter, with 234,000 from expanding establishments and 38,000 from new establishments. At the same time, gross job losses amounted to 1,160,000 in the second quarter, with 1,081,000 from contracting establishments and 79,000 from closing establishments. Overall, there was a net change of 9,000 fewer establishments in the manufacturing sector in the second quarter, with 19,000 manufacturing establishments closing.
In addition, there were 5,000 manufacturing start-ups in the second quarter, or a rate of 1.6% of all establishments in the sector. Those new establishments (or “births”) employed 21,000 workers in the second quarter, the same pace as in the first quarter but down from 24,000 in the fourth quarter of 2019. The pace of manufacturing start-ups has been relatively flat for about a decade, and notably, entrepreneurship in the sector (as well as economy-wide) has slowed from the rates in the 1990s and early 2000s.
- Chicago Fed National Activity Index: The Chicago Federal Reserve Bank’s National Activity Index rose from 0.31 in November to 0.52 in December, with the data remaining positive for the eighth straight month. Readings above zero are consistent with the U.S. economy expanding above its historical trend. The three-month moving average edged up from 0.59 in November to 0.61 in December. This report continues to provide some encouragement that the nation is beyond the worst of the recession, with growth stabilizing even as challenges persist.
For its part, manufacturing production increased 0.9% in December, also expanding for the eighth consecutive month. Nonetheless, output in the sector remained 2.6% below the pre-pandemic level seen last February. Production-related indicators added 0.44 to December’s NAI, up from contributing 0.13 in November. Employment-related indicators also slowed, but they added 0.13 to the topline. In contrast, personal consumption and housing indicators subtracted 0.09, largely on weakness in consumer spending in December.
- Conference Board Consumer Confidence: While consumer confidence ticked higher overall, up from 87.1 in December to 89.3 in January, the Conference Board noted a weakening in Americans’ assessment of the current economic environment. Sentiment has decreased as new COVID-19 restrictions are imposed in many areas. With that said, the headline index rose on improved perceptions of the outlook for the next six months.
The underlying data reflected the mixed picture. The percentage of respondents suggesting that business conditions were “good” edged up from 15.4% to 15.8%, but with the percentage feeling that conditions were “bad” rising from 39.7% to 42.8%. Those completing the survey also had a weakened assessment of the labor market, with the percentage of respondents feeling jobs were “plentiful” decreasing from 21.0% to 20.6%. At the same time, those saying jobs were “hard to get” rose from 22.9% to 23.8%.
Yet, respondents also expressed optimism for stronger economic conditions moving forward. The percentage of consumers anticipating better business conditions over the next six months increased from 29.5% to 33.7%, with those predicting a worsening of conditions ticking down from 22.0% to 18.1%. At the same time, the percentage of respondents expecting more jobs in the next six months rose from 28.0% to 31.3%, with those expecting fewer jobs inching down from 22.2% to 21.4%.
- Conference Board Leading Indicators: The Leading Economic Index rose 0.3% in December, slowing from the 0.7% gain in November but rising for the eighth consecutive month. Still, the LEI remained 2.1% lower than the pre-pandemic levels in February. New manufacturing orders contributed positively to the LEI for the seventh straight month. Other bright spots in December included the average workweek of production workers, building permits, the interest rate spread, lending conditions and the stock market. At the same time, consumer confidence and initial unemployment claims both pulled the LEI lower for the month.
Meanwhile, the Coincident Economic Index also increased 0.3% in December, but the measure remained down 4.0% since February despite rising for the eighth consecutive month. Manufacturing and trade sales were a drag on the CEI in December, with disappointing retail sales data for the month. The three other components—industrial production, nonfarm payrolls and personal income less transfer payments—contributed positively in December. For its part, manufacturing production rose 0.9% in December. However, output in the sector remained 2.6% below pre-pandemic levels.
- Dallas Fed Manufacturing Survey: Manufacturing activity expanded for the sixth straight month in January but at the slowest pace since July. The composite index of general business conditions declined from 10.5 in December to 7.0 in January, with easing growth for new orders, production, shipments and employment. Encouragingly, the number of hours worked increased at the fastest rate since September 2018, with capital expenditures improving to the best reading since December 2019. At the same time, raw material costs have escalated, accelerating at a pace not seen since April 2011.
Looking ahead, manufacturers in the Texas district remained upbeat in their outlook for the next six months, with the forward-looking composite measure rising from 17.8 in December to 29.6 in January, the highest since October 2018. At least half of respondents predict increased new orders, shipments and production in the coming months, with 43.0% and 34.3% forecasting more hiring and capital spending, respectively. Input prices are expected to continue to accelerate rapidly, rising at the strongest rate since March 2012.
- Durable Goods Orders and Shipments: New orders for durable goods rose 0.2% in December, slowing from the 1.2% gain in November but rising for the eighth straight month. Defense and nondefense aircraft and parts sales fell sharply, but strong increases for machinery and motor vehicles and parts, among other segments, boosted the headline measure. Excluding transportation equipment, new durable goods orders increased 0.7% in December.
Overall, the durable goods sector has rebounded solidly following steep declines in activity last spring due to the COVID-19 pandemic. On a year-over-year basis, new durable goods orders have grown 1.4% since December 2019, or a relatively strong 6.5% increase with transportation equipment excluded. Core capital goods orders have risen 7.8% over the past 12 months. Orders for nondefense capital goods excluding aircraft—a proxy for capital spending in the U.S. economy—rose 0.6% from $71.36 billion in November to $71.77 billion in December, a new monthly record.
Meanwhile, durable goods shipments increased 1.4% in December, with a 0.8% gain with transportation equipment excluded. Over the past 12 months, durable goods shipments have risen 3.4%. Excluding transportation, shipments have increased 4.3% year-over-year. In addition, core capital goods shipments grew 0.4% from $69.89 billion in November to $70.21 billion in December, an all-time high, with 6.2% growth year-over-year.
- Employment Cost Index: Private manufacturing wages and salaries rose 0.6% in the fourth quarter, the same pace as in the third quarter. That translated into 2.6% growth over the past 12 months, the slowest pace since the second quarter of 2018. For all private-sector employees, wages and salaries increased 0.9% in the fourth quarter, up from 0.5% in the third quarter, with 2.8% growth year-over-year.
Benefits costs for manufacturing employees jumped 0.7% in the fourth quarter, rebounding from 0.2% in the third quarter, which was the slowest rate in two years. On a year-over-year basis, benefits have risen a modest 1.8%. Overall, total manufacturing compensation also increased 0.7% for the quarter, or 2.4% year-over-year.
- FOMC Monetary Policy Statement: The Federal Reserve kept short-term interest rates unchanged, as expected, citing the “tremendous human and economic hardship” caused in the economy due to COVID-19 as justification for continuing to maintain accommodative policies. The Federal Open Market Committee also noted, “The path of the economy will depend significantly on the course of the virus, including progress on vaccinations.” In addition to keeping the target range for federal funds at zero to 25 basis points, the Federal Reserve will also continue to increase its holdings of Treasury and mortgage-backed securities in an effort to help facilitate economic growth and maintain sufficient liquidity in the marketplace.
The FOMC will reevaluate its monetary policy stance based on incoming data, but it is widely expected to keep interest rates unchanged for at least all of 2021.
- Gross Domestic Product (Fourth Quarter): The U.S. economy slowed in the fourth quarter, with consumer spending on goods pausing with COVID-19 cases on the rise and renewed restrictions placed in many areas. Real GDP rose 4.0% at the annual rate in the fourth quarter, and the U.S. economy shrank 3.5% in 2020, the largest annual decline in economic activity since 1946. The U.S. economy is expected to rebound in 2021, especially as more Americans get vaccinated and market participants resume some semblance of normalcy in their actions. The current forecast is for 4.8% growth in 2021.
Breaking down the details in this report:
- Personal consumption expenditures increased an annualized 2.5% in the fourth quarter, largely from a 4.0% gain in spending on services. Goods spending fell 0.4% in the quarter, with durable goods flat and nondurable goods purchasing down 0.7%. Service-sector spending contributed 1.80% to real GDP growth, but goods spending subtracted 0.10%.
- Business investment rose solidly, up 25.3% at the annual rate in the fourth quarter, rebounding for the second straight report. In the fourth quarter, nonresidential and residential investment grew 13.8% and 33.5%, respectively. Spending on structures increased (up 3.0%) for the first time since the third quarter of 2019, with solid growth rates for equipment and intellectual property products. The housing market remained a bright spot. Overall, business fixed investment added 4.06% to topline GDP growth in the fourth quarter, with spending on inventories contributing another 1.04%.
- Net exports of goods and services subtracted 1.52% from topline growth in the fourth quarter, dragging down real GDP for the second consecutive quarter. Trade activity continued to bounce back, but with imports recovering faster than exports. Goods exports and imports rose 31.1% and 30.8% at annual rates in the fourth quarter. Real goods exports have declined 3.6% over the past 12 months, but real goods imports have increased 5.3% over that time frame.
- Government spending subtracted 0.22% from real GDP growth in the fourth quarter. Federal government spending fell 0.5% at the annual rate in the fourth quarter, extending the 6.2% decline in the third quarter. At the same time, state and local government spending declined 3.9% and 1.7% in the third and fourth quarters, respectively, highlighting economic challenges.
- International Trade in Goods (Preliminary): In advance statistics, the goods trade deficit pulled back from an all-time high, down from $85.49 billion in November to $82.47 billion in December. Goods exports increased from $127.54 billion to $133.44 billion, the best reading since February. That was enough to outpace the gain in goods imports, which increased from $213.02 billion to $215.90 billion, the strongest pace since December 2018. Each has bounced back following steep declines in the spring due to the COVID-19 pandemic and global recession.
Strength in automotive vehicles; capital goods; foods, feeds and beverages; and industrial supplies led the increase in goods exports in December. At the same time, goods imports were supported by strength in automotive vehicles and industrial supplies, but imports for consumer goods and foods, feeds and beverages were lower. Final data will be released Feb. 5, which will also include the service-sector trade surplus.
- Kansas City Fed Manufacturing Survey: Manufacturing activity expanded for the eighth straight month, with the composite index of general business conditions rising from 14 in December to 17 in January, the best reading since November 2018. Growth accelerated for new orders, exports, shipments, production and employment in January, starting the new year off on a high note. At the same time, prices for raw materials jumped at the fastest pace since April 2011, with the sample comments noting supply chain constraints and higher commodity costs, particularly for steel.
Respondents continued to feel cautiously positive about additional growth over the next six months, with solid expansions expected for new orders, production and hiring and modest gains for capital spending and exports. The forward-looking composite index was the best since September 2018. With that said, 93% said that “widespread COVID-19 vaccination is important to their firm’s overall business outlook for 2021.”
- New Home Sales: New single-family home sales rose 1.6% from 829,000 units at the annual rate in November to 842,000 units in December. Sales strengthened in the Midwest and West in the latest data, but decreased in the Northeast and South. While these data remain below July’s pace (979,000 units), which was the best since December 2006, new home sales remain elevated overall, buoyed by mortgage rates that are near historic lows. Over the past 12 months, new single-family home sales have jumped 15.2%, up from 731,000 units in December 2019 and with robust gains in each region of the country except the Northeast.
There were 4.3 months of supply on the market in December, but inventories of new homes for sales remain low overall. For instance, there were 5.3 months of supply on the market one year ago. The median sales price registered $355,900 in December, up 8.0% year-over-year.
- Personal Consumption Expenditures Deflator: After being flat in both October and November, the PCE deflator rose 0.4% in December. Overall, the PCE deflator has risen 1.3% year-over-year, and core inflation, which excludes food and energy costs, has increased 1.5% over the past 12 months. Energy prices jumped 4.2% in December, with food costs rising 0.2%. On a year-over-year basis, energy prices have fallen 7.6%, with food prices up 3.9%.
Despite higher costs in recent months, the core PCE deflator has remained below 2% for 25 consecutive months. More than anything, the Federal Reserve remains more worried about economic growth than inflation, as seen in the extraordinary measures taken over the past few months to help prop up the economy and to address credit and liquidity concerns in financial markets.
- Personal Income and Spending: Personal consumption expenditures declined 0.2% in December, pulling back for the second straight month. Durable and nondurable goods purchases fell 1.0% and 0.7% in December, respectively, with service-sector spending edging up 0.1%. These data suggest that Americans felt more hesitant in their spending in November and December, particularly with rising COVID-19 cases and restrictions in many markets. The saving rate continued to be highly elevated at 13.7% in December, up from 12.9% in November. The saving rate averaged 16.2% in 2020, well above the 7.5% average in 2019. As such, consumers felt significantly more cautious in their purchasing in 2020 in light of the pandemic and economic recession.
Over the past 12 months, personal spending has fallen 2.0% since December 2019. Consumers spent 5.4% less on services in December than one year earlier. More encouragingly, durable and nondurable goods spending rose 11.0% and 2.5% year-over-year, respectively.
Meanwhile, personal income rose 0.6% in December following declines in both October and November. The data were heavily influenced by transfer payments in 2020, including in December. Unemployment insurance has soared from $27.8 billion in February to $1.40 trillion in June. In the latest data, it increased from $281.2 billion in November to $321.4 billion in December. Overall, personal income has risen 4.1% over the past 12 months.
Wages and salaries rose 0.5% in December, with 2.3% growth over the past 12 months. Manufacturing wages and salaries increased from $956.4 billion in November to $958.1 billion in December, with 3.7% growth over the past 12 months.
- Richmond Fed Manufacturing Survey: Manufacturing businesses in the Richmond Federal Reserve Bank’s district expanded for the seventh straight month, but with the composite index of general business activity easing from 19 in December to 14 in January. The underlying data slowed for most of the key measures, including new orders, shipments, capacity utilization and capital expenditures. In contrast, hiring accelerated somewhat, and firms continued to cite challenges with finding talent. Meanwhile, the forward-looking indicators remained encouraging, with manufacturers in the district expecting continued growth in activity over the next six months.
Raw material costs jumped from 2.10% at the annual rate in December to 3.11% in January, the fastest pace since March 2019. In addition, respondents anticipate an annualized 3.06% increase in costs six months from now, up from 2.76% in the prior survey and the highest since February 2020.
- State Employment Report: Wisconsin created the most net new manufacturing jobs in December, adding 6,500 workers. Other states with notable employment growth for the month included New York (up 5,100), Georgia (up 4,500), North Carolina (up 4,500) and Virginia (up 4,400).
Despite gains over the past eight months, manufacturing employment figures remain down by 543,000 since the COVID-19 pandemic began. Since February 2020, the states with the largest job decreases in the sector included California (down 99,900), Michigan (down 61,500), New York (down 37,800), Indiana (down 36,100), Pennsylvania (down 33,600), Ohio (down 31,900) and North Carolina (down 31,500).
In contrast, six states have higher employment in the sector since the pandemic began last February: Utah (up 4,600), Idaho (up 3,300), Colorado (up 2,000), South Carolina (up 1,800), Iowa (up 600) and West Virginia (up 500).
The national unemployment rate remained at 6.7% in December, and the unemployment rate fell in 19 states in the latest data. Hawaii had the highest unemployment rate in the country at 9.3%, followed closely by Nevada (9.2%) and California (9.0%). At the other end of the spectrum, the lowest unemployment rates in the United States in December occurred in Nebraska (3.0%), South Dakota (3.0%), Iowa (3.1%) and Vermont (3.1%).
- University of Michigan Consumer Sentiment (Revision): Consumer confidence declined from 80.7 in December to 79.0 in January, according to revised data from the University of Michigan and Thomson Reuters. That was a slight downward revision from the previous estimate, which was 79.2. Overall, Americans felt less upbeat in their assessment of both current economic conditions and the outlook for the coming months. Wide disparities along partisan lines remained, with Democrats feeling more positive than Republicans post-election. The rise in COVID-19 cases and political challenges served as drags on confidence in January, despite optimism surrounding vaccinations and the prospects of normalization at some point later this year.
- Weekly Initial Unemployment Claims: Initial unemployment claims totaled 847,000 for the week ending Jan. 23, pulling back for the second straight release, down from 914,000 claims for the week ending Jan. 16. Despite overall progress, particularly since last spring, the pace of first-time unemployment insurance claims remains highly elevated, illustrating continuing pain in labor markets.
Meanwhile, continuing claims declined from 4,974,000 for the week ending Jan. 9 to 4,771,000 for the week ending Jan. 16, the lowest level since the week ending March 28, 2020, but still too high and consistent with 3.4% of the workforce.
At the same time, 18,282,090 Americans received some form of unemployment insurance benefit (including state and federal programs) for the week ending Jan. 9. This figure represents a sizable increase from 15,988,595 for the week ending Jan. 2, largely on significant gains for pandemic assistance, which was strengthened through new legislation passed at year’s end.
|
|
|
Thank you for subscribing to the NAM’s Monday Economic Report.
If you’re part of an NAM member company and not yet subscribed, email us. If you’re not an NAM member, become one today!
|
|
|
|
|
|
|
|
|
| Interested in becoming a presenter of the Monday Economic Report? Email us. |
|
| Questions or comments? Email NAM Chief Economist Chad Moutray at [email protected]. |
|
| You received this email because you signed up for the NAM’s Monday Economic Report as a part of your NAM membership. |
|
| Unsubscribe |
|
 |
|
| © 2021 National Association of Manufacturers |
|
|
|
|
|
|
|
